
Workforce visibility operations is the practice of collecting real-time, task-aware data about your workforce — where people are, what they’re working on, whether they’re on schedule, and whether they’re safe — and turning that data into decisions you can act on immediately. For field and mobile teams especially, it’s the difference between managing by assumption and managing by fact. Operations and HR teams that build this capability consistently see faster dispatching, fewer idle hours, and safer jobsites. Platforms like CHERP and SiteComm by Debecorp were built specifically for this problem in the skilled trades, where crews are mobile, tasks are granular, and OSHA compliance is non-negotiable.
Table of Contents
- Why workforce visibility matters for operations and HR
- What makes up the workforce visibility stack
- How visibility creates an intelligence cycle that powers daily operations
- Which technologies actually enable real-time workforce visibility
- A practical roadmap: how to implement workforce visibility from pilot to scale
- KPIs, dashboards, and alerts: what you should actually measure
- Common challenges, adoption blockers, and U.S.-specific privacy considerations
- How operations teams use workforce visibility every day
- How CHERP and SiteComm apply workforce visibility in the trades
- Key Takeaways
- The visibility gap most operations leaders underestimate
- CHERP and SiteComm give trades teams real operational control
- Useful sources and further reading
Why workforce visibility matters for operations and HR
The operational case is straightforward: you cannot fix what you cannot see. Real-time visibility lets teams shift resources and resolve bottlenecks quickly, which directly improves productivity and SLA compliance. That plays out in concrete ways every day.
Operational benefits:
- Faster dispatching when a crew member is delayed or a task changes priority
- Fewer missed shifts caught before they cascade into rework or overtime
- Reduced idle time when supervisors can see task status without walking the site
HR benefits:
- Fairer scheduling backed by actual attendance and availability data
- Absence trend detection that lets HR intervene before a pattern becomes a staffing crisis
- Targeted training decisions based on who is completing tasks correctly and who needs support
Safety and compliance: OSHA requires employers to maintain accurate injury and illness records and to respond to incidents promptly. Visibility tools that log safety checks, equipment assignments, and crew locations make that response faster and the records more defensible.
The business outcome is a tighter cost-per-shift, higher workforce utilization, and on-time delivery rates that hold up under scrutiny. Visibility also surfaces inefficiencies that leaders can address with targeted training before they escalate — a mutual benefit for the organization and the worker.
What makes up the workforce visibility stack
True visibility goes well beyond time clocks. It includes task progress, output versus expectation, and cross-shift interactions. The Work Management Institute defines work visibility as the ability for everyone in a workflow to understand what work exists, who owns it, its status, priorities, deadlines, and dependencies. That’s a useful frame for operations teams building their data model.

Data elements you need to capture:
| Data Element | What It Tells You | Example Source |
|---|---|---|
| Location | Where workers are in real time | GPS, BLE, RFID tags |
| Status / availability | Clocked in, on task, idle, traveling | Mobile app check-in |
| Task-level output | What was completed, at what rate | Field app task logs |
| Skills / certifications | Who is qualified for which work | HR system, safety records |
| Schedule / roster | Who is assigned where and when | Workforce management system |
| Safety logs | Incidents, near-misses, equipment checks | EHS / daily log entries |
| Equipment assignment | What tools and assets are in use | Equipment tracking module |
System components that make the stack work:
- Mobile collection layer (field apps, BLE/UWB/RFID tags, GPS devices)
- Connectivity and offline buffering for jobsite conditions
- Middleware or ETL layer to normalize data from multiple sources
- Real-time dashboard with live roster and task views
- Rules engine and alerting for exceptions (late arrivals, coverage gaps, safety triggers)
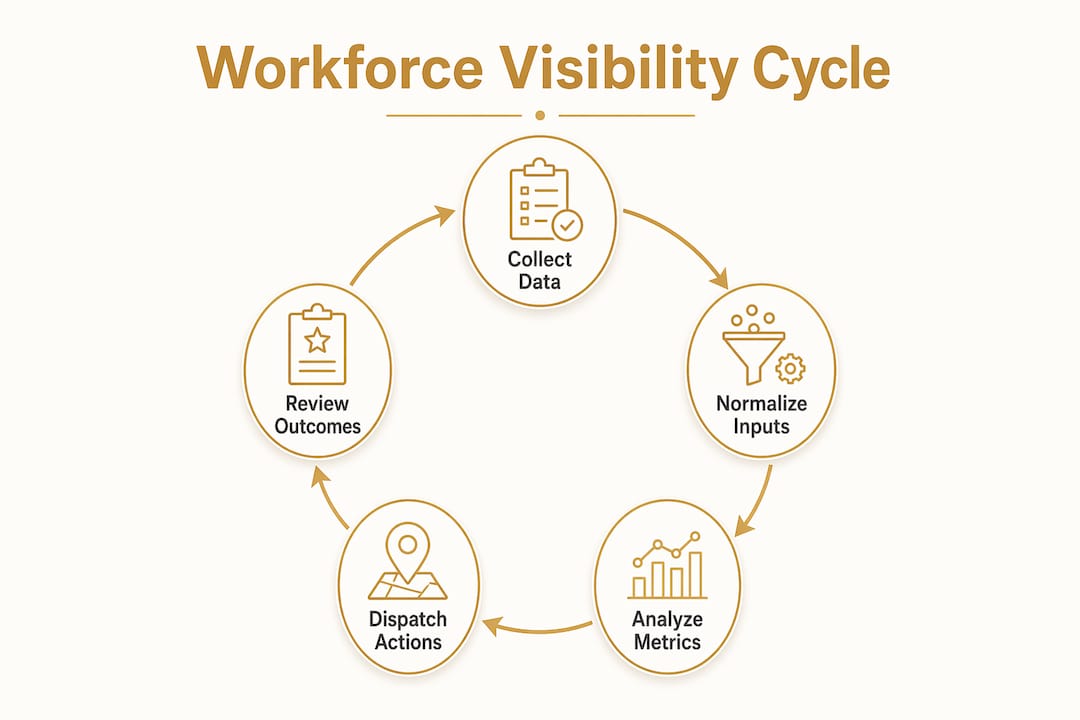
The flow looks like this: first-mile field data (task events, timestamps, location pings) feeds into a normalization layer, which populates a real-time dashboard, which triggers alerts and actions. Basic time-clock data only covers the first step. Task-level and contextual telemetry — equipment logs, safety checklists, material usage — are what turn attendance tracking into genuine operational control.
How visibility creates an intelligence cycle that powers daily operations
Real-time data is only useful if it drives a decision. The visibility-to-intelligence cycle is a closed loop, and every step matters:
- Collect. Field apps, tags, and sensors capture task events, location, and status as work happens.
- Normalize. A middleware layer reconciles identifiers across systems (HR IDs, device IDs, task codes) into a single record.
- Detect. The rules engine compares actual status against expected status and flags exceptions.
- Alert. Supervisors and dispatchers receive a notification: a crew is running 30 minutes behind, a safety check is overdue, a task is unassigned.
- Act. The dispatcher reroutes a nearby crew, the supervisor reassigns a task, or HR flags the absence for follow-up.
- Learn. Aggregated exception data feeds weekly and monthly planning, improving schedules and staffing models over time.
The practical payoff is shorter decision latency. Instead of a supervisor discovering a problem at the end-of-day debrief, the alert fires in real time and the fix happens while the work is still in progress. That’s what reduces firefighting. Real-time jobsite updates are the mechanism; the intelligence cycle is the outcome.
Pro Tip: Start the cycle with a single, high-impact use case — for example, late crew arrivals triggering automatic reassignment. Prove the loop works on one workflow before expanding to the full site.
Which technologies actually enable real-time workforce visibility
The toolset is a stack, not a single product. Operations teams typically assemble several categories and integrate them.
Tool categories:
- Mobile field apps: The primary data-collection surface for field workers. Offline-first design matters on jobsites with poor connectivity.
- RTLS (Real-Time Location Systems): BLE, UWB, RFID, and GPS technologies that monitor location, zone occupancy, and movement for dashboards and alerts.
- Workforce management and scheduling: Systems that hold the roster, shift plans, and availability data.
- Labor management and task tracking: Tools that capture task assignments, completions, and output rates.
- Middleware / ETL: The integration layer that connects field data to enterprise HR, ERP, or BI systems.
- BI and dashboards: Platforms like Tableau, Power BI, or embedded analytics that surface KPIs to operations leaders.
- EHS / safety systems: Modules or standalone tools that log incidents, certifications, and compliance checks.
Integration checklist before going live:
- Identity sync: confirm worker IDs match across HR, scheduling, and field app systems.
- Schedule and roster feeds: automate daily roster pushes to the field app so dispatchers see current assignments.
- Task definitions: standardize task codes so field data maps cleanly to project and cost codes.
- Device provisioning: assign and register every mobile device or tag before the pilot starts.
- Data latency SLAs: define acceptable lag (e.g., location updates every 60 seconds, task completions within 5 minutes).
- Single source of truth: designate one system as the authoritative record for each data type.
On architecture: edge collection (processing data on the device or a local gateway) reduces latency and handles connectivity gaps. Cloud processing handles aggregation, analytics, and cross-site reporting. For most trades and construction teams, an offline-first mobile app with periodic sync is the right starting point. Mobile attendance tracking for jobsites covers the practical device and connectivity considerations in detail.
The build-versus-buy question comes down to integration complexity. A packaged platform purpose-built for your trade reduces the integration burden significantly. Best-of-breed integrations give more flexibility but require a dedicated IT resource to maintain the connections.
A practical roadmap: how to implement workforce visibility from pilot to scale
The biggest implementation mistake is trying to instrument everything at once. Start narrow, prove the value, then expand.
- Scope the pilot. Pick one site, one crew type, or one workflow. The goal is to capture first-mile field data cleanly before touching enterprise systems.
- Assign stakeholder roles. Operations lead owns the use case and success criteria. HR/people lead owns consent, privacy, and scheduling data. IT/integration lead owns the data connections. Safety/EHS owns compliance logging. Field supervisors own adoption on the ground.
- Map the data. Document what data exists today, where it lives, and what’s missing. Identify the gaps between your current time-clock data and the task-level data you need.
- Provision devices and apps. Roll out mobile apps or tags to the pilot crew. Test offline sync, battery life, and connectivity before day one.
- Run a 4–8 week pilot. Collect data, watch the dashboard, and let supervisors use the alert feed. Do not optimize yet — observe first.
- Measure against success criteria. Data completeness (are all tasks being logged?), decision latency (how quickly are exceptions resolved?), and at least one KPI improvement (utilization rate, on-time arrival %).
- Adjust and document. Fix data gaps, refine alert thresholds, and document what worked. This becomes the playbook for the next site.
- Scale with a change management plan. Communication, training, and adoption incentives come before the second rollout, not after.
Pro Tip: Map field-level activities before integrating with enterprise HR or ERP systems. Semantic mismatches between field task codes and ERP project codes are the most common cause of pilot delays — resolve them at the field level first.
For cost and effort: a software-only pilot using an existing mobile platform is the lowest-cost entry point. Hardware-heavy RTLS deployments (BLE beacons, UWB anchors) add cost and setup time but deliver richer location data. Most trades teams start with a mobile app and add location hardware only where the use case justifies it. Construction workforce planning covers the forecasting and staffing decisions that follow a successful pilot.
KPIs, dashboards, and alerts: what you should actually measure
| KPI | Definition | How to Calculate |
|---|---|---|
| Workforce utilization | % of scheduled hours spent on productive tasks | Productive hours ÷ scheduled hours |
| On-time arrival % | % of shifts started within the defined window | On-time starts ÷ total scheduled starts |
| Travel / wait time | Average non-productive time per shift | Total travel + idle minutes ÷ total shifts |
| Task completion velocity | Tasks completed per crew per day | Total tasks completed ÷ crew-days worked |
| First-time fix rate | % of tasks completed without a return visit | First-visit completions ÷ total task assignments |
| Safety incidents per hours worked | Incident rate normalized to exposure | Incidents ÷ total hours worked |
Dashboard widgets that operations leaders actually use:
- Live roster map showing crew locations and current task status
- Task backlog by crew, sorted by priority and due time
- Utilization heatmap by site, day, and crew type
- Exception queue: late arrivals, overdue tasks, missed safety checks
Alert threshold examples:
- Coverage below 80% of scheduled headcount triggers a supervisor notification
- Task delay exceeding 45 minutes with no status update triggers a dispatcher alert
- Safety check overdue by more than 30 minutes triggers an EHS flag
- Utilization below 60% for two consecutive shifts triggers an HR review flag
Labor productivity tracking for construction managers goes deeper on how to set and benchmark these metrics for field crews.
Common challenges, adoption blockers, and U.S.-specific privacy considerations
Technical challenges:
- Fragmented data sources with inconsistent worker identifiers across HR, scheduling, and field systems
- Connectivity gaps on jobsites that break real-time data feeds
- Legacy time-clock systems that export only summary attendance data, not task-level events
Organizational challenges:
- Manager workload: supervisors who are already stretched resist adding a new tool to their day
- Perceived surveillance: workers worry that location tracking is punitive, not supportive
- Adoption resistance when the tool wasn’t designed with field workers in mind
U.S.-specific privacy and labor considerations:
- Consent and notice: Several U.S. states require employers to notify workers before implementing location tracking. California, Illinois, and New York have specific notice requirements. Always consult employment counsel before deploying GPS or RTLS.
- Off-the-clock risk: If a worker’s location or task data is captured outside scheduled hours, it can create wage-and-hour liability under the Fair Labor Standards Act. Define clear data-collection windows.
- OSHA safety reporting: Visibility data that captures near-misses and incidents can support OSHA 300 log accuracy, but it can also surface recordable events that might otherwise go unreported. Build your logging policy with legal counsel.
- Role-based access: Limit who can see individual worker location data. Supervisors need operational views; executives need aggregate dashboards. Privacy by design means the least-permissive access that still enables the use case.
- Data retention: Define how long location and task data is retained. Thirty to ninety days is common for operational data; longer retention requires a documented business justification.
Pro Tip: Frame visibility to workers as “work transparency and support” — the system helps supervisors get resources to crews faster and documents completed work accurately for payroll and recognition. That framing materially improves buy-in during pilots.
How operations teams use workforce visibility every day
1. Dispatching and dynamic reassignment. A field service team gets a high-priority call. The dispatcher sees on the live roster map that one technician just completed a task three miles away. The reassignment happens in under two minutes, the SLA is met, and travel time drops because the nearest qualified worker gets the job.
2. Construction crew coordination. A concrete pour is scheduled for 7 AM. The visibility dashboard shows two crew members haven’t checked in by 6:45 AM. The supervisor calls in a standby worker before the pour starts, avoiding a costly delay. Construction project timelines depend on exactly this kind of early-warning coordination.
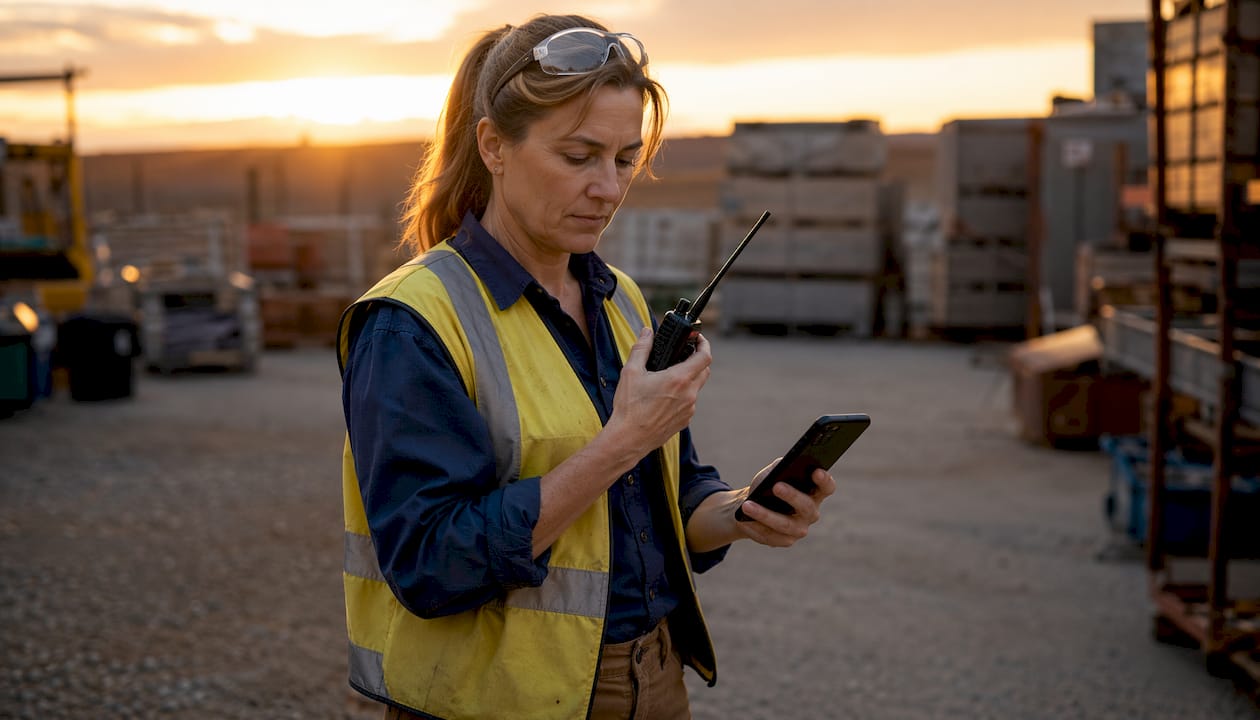
3. Safety incident response. A worker triggers a safety alert on a confined-space entry. The system logs the location, the time, and the crew members in the zone. The supervisor has an accurate roll call within 90 seconds without walking the site. OSHA incident documentation is generated from the same log.
4. HR absence management. The HR dashboard flags a pattern: the same three workers have called out on Mondays for six consecutive weeks. HR schedules a check-in before the pattern becomes a retention problem. Shift coverage is rebalanced without overstaffing the rest of the week.
5. Forecasting and capacity planning. Three months of task completion velocity data shows that a specific crew type consistently underperforms on large-format installations. Operations adjusts crew composition for the next project phase before the schedule slips.
How CHERP and SiteComm apply workforce visibility in the trades
Debecorp built CHERP and SiteComm from the ground up with input from tradespeople who work in the field every day. That origin matters because most workforce visibility tools were designed for office environments and retrofitted for the field. CHERP wasn’t.
What trades teams gain with CHERP: A single mobile platform that handles time and attendance, daily logs, safety compliance checklists, task-level tracking, and per-trade field calculators — all in one place, with offline support for jobsites where connectivity is unreliable. SiteComm adds the community layer: jobsite chat, peer recognition, and worker-owned social features that make adoption feel less like surveillance and more like a tool workers actually want to use.
CHERP and SiteComm capabilities that map directly to workforce visibility:
- Time and attendance with GPS-verified clock-in for accurate first-mile data
- Role-based daily logs and safety checklists that capture task-level output, not just attendance
- Crew hierarchy and role-based admin so supervisors see their crew’s data, not the whole company’s
- Per-trade field calculators that reduce errors and speed up task completion logging
- Offline-first Android and web deployment for jobsites with poor connectivity
- Material and equipment tracking that adds contextual data to the visibility stack
- Jobsite chat and peer recognition that support the change management side of adoption
Field worker productivity tools explains how these capabilities translate to measurable output improvements for trades crews.
Key Takeaways
Workforce visibility operations works when real-time, task-level field data feeds a closed intelligence cycle that lets operations and HR act on exceptions before they become problems.
| Point | Details |
|---|---|
| Start with task-level data | Time clocks alone are not enough; capture task output, location, and safety logs from day one. |
| Pilot one workflow first | Pick a single site or crew type, run a 4–8 week pilot, and measure data completeness before scaling. |
| Define KPIs before launch | Set utilization, on-time %, and task completion velocity targets so the pilot has clear success criteria. |
| Address U.S. privacy rules early | Consent, notice, and off-the-clock data risks require employment counsel before any location tracking goes live. |
| Debecorp’s CHERP and SiteComm | Built for trades teams, CHERP delivers time and attendance, task logs, safety compliance, and offline mobile in one platform. |
The visibility gap most operations leaders underestimate
Operations leaders who invest in workforce visibility often focus on the technology and underestimate the data quality problem underneath it. A live dashboard is only as good as the data feeding it, and in field operations, that data is captured by workers who are busy, often in poor connectivity, and sometimes skeptical of why they’re being tracked.
The teams that get the most out of visibility programs are the ones that solve the adoption problem first. That means designing the data-collection experience for the worker, not the analyst. If logging a task takes 30 seconds on a mobile app, workers do it. If it takes five minutes navigating a clunky interface, they skip it, and your dashboard shows garbage.
The second underestimated factor is the intelligence cycle itself. Most organizations implement a dashboard and stop there. The dashboard shows you what happened. The intelligence cycle is what lets you change what happens next. That requires a rules engine, alert routing, and a supervisor who has the authority and the habit of acting on the alert within minutes, not hours. That’s a process change, not a technology change, and it’s where most visibility programs stall.
My advice: endorse a pilot, protect a single source of truth, and measure decision latency as your first KPI. If your supervisors are resolving exceptions faster in week eight than they were in week one, the program is working.
CHERP and SiteComm give trades teams real operational control
Most workforce visibility platforms were built for enterprise office environments and adapted for the field as an afterthought. CHERP and SiteComm were built the other way around, starting with the specific challenges trades crews face: mobile work, offline conditions, trade-specific tasks, and workers who need a tool that respects their time and their craft.
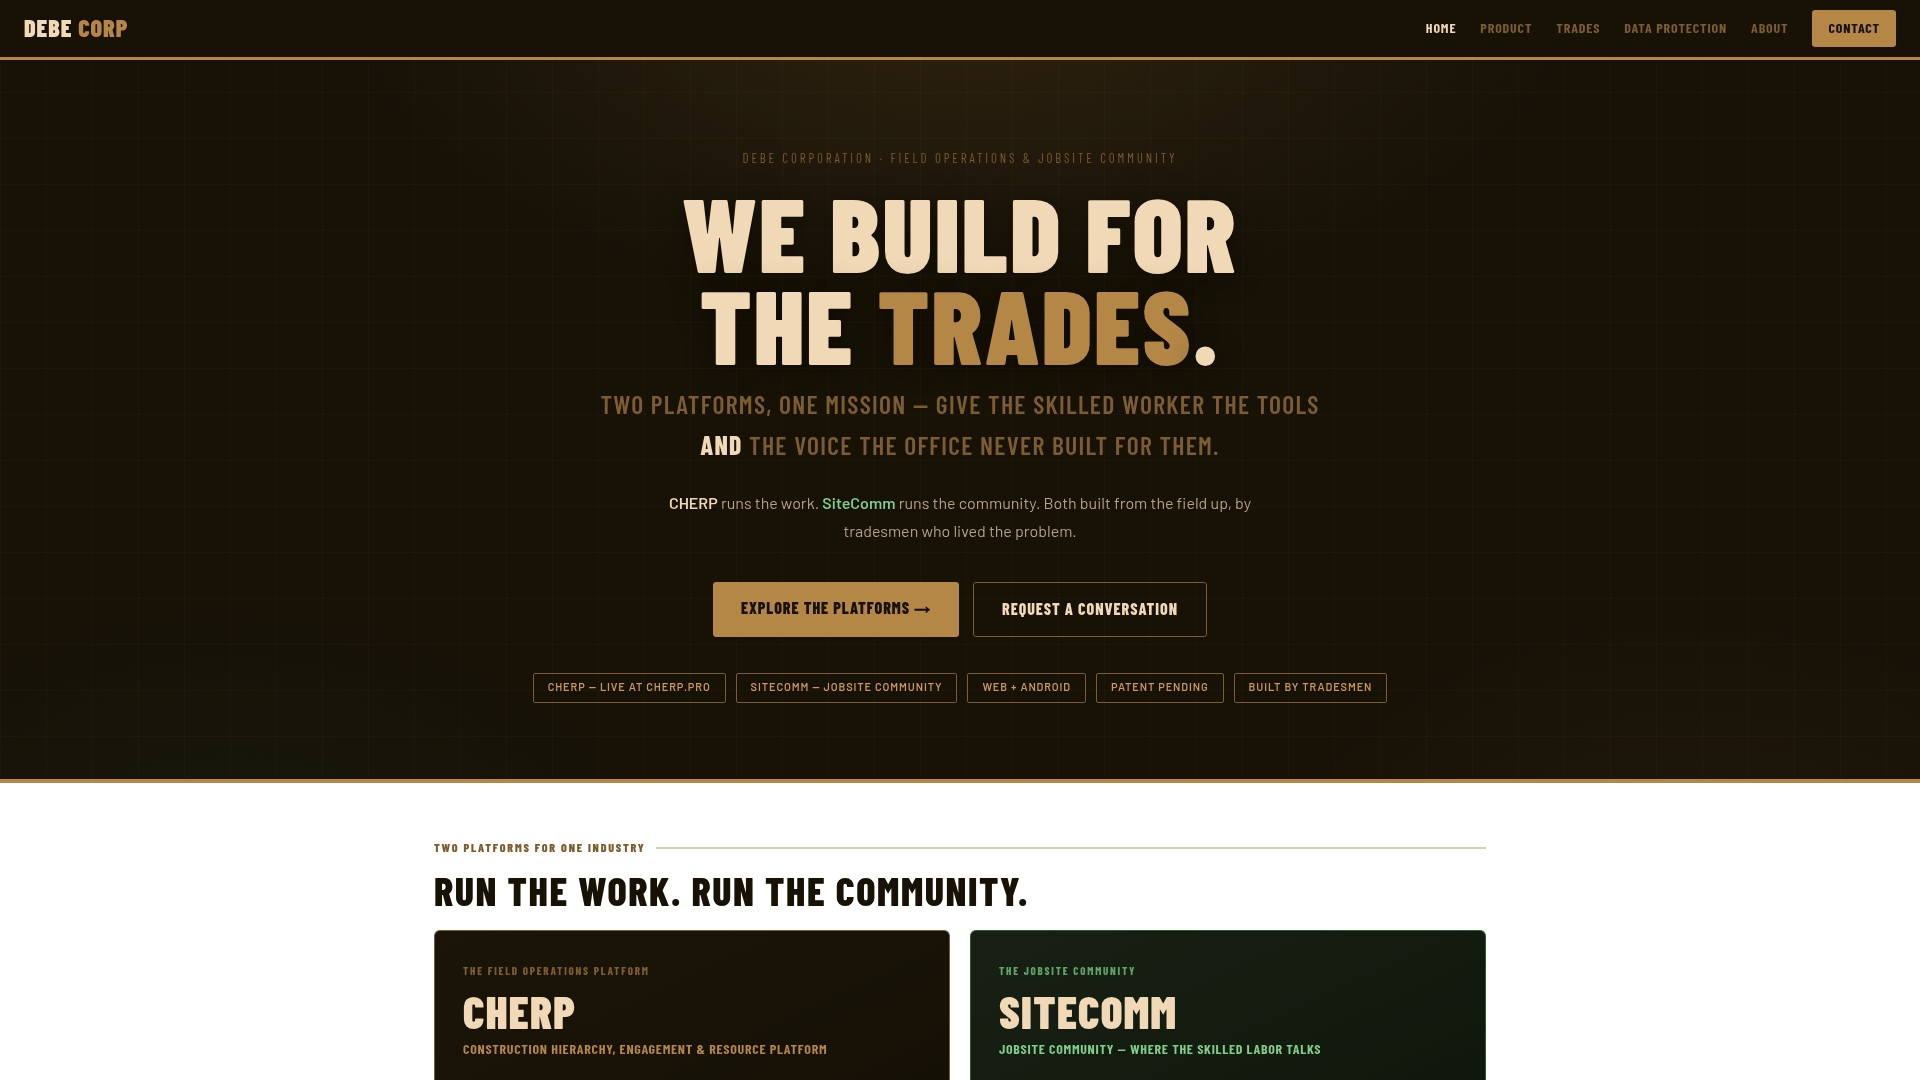
CHERP handles the operational core: GPS-verified time and attendance, role-based daily logs, safety compliance checklists, task tracking, and per-trade calculators, all on Android and web with offline support. SiteComm handles the human side: jobsite chat, peer recognition, and community features that make workers want to use the platform rather than tolerate it. Together, they give operations leaders the real-time data they need to dispatch faster, reduce idle time, and document safety compliance without adding administrative burden to the field.
Explore CHERP and SiteComm or visit Debecorp’s trades page to see the per-trade capabilities and request a demo for your crew.
Useful sources and further reading
- Workforce KPI: Essential for Operational Success (iJility) — Practical framing of real-time visibility as a measurable KPI, with use cases for field operations teams.
- Workforce Visibility: Definition, Benefits & How to Improve (Tivazo) — Covers the full scope of visibility beyond attendance, including task progress and cross-shift interactions.
- What Is Work Visibility? Definition, Benefits, and Examples (Work Management Institute) — Institutional definition of work visibility and its role in coordinating people, systems, and workflows.
- What Is Workforce Visibility and Why Does It Matter? (e-days) — HR-focused perspective on absence tracking, wellbeing, and fair scheduling as visibility outcomes.
- Workforce Visibility System: Real-Time RTLS (SYTRAK) — Technical overview of BLE, UWB, RFID, and GPS technologies used in workforce location systems.
- Gartner IT Glossary: Business Intelligence — Authoritative definition of BI as the analytical layer that turns workforce data into strategic insight.