
Use this ready-to-copy operational efficiency checklist to stop site delays, cut rework, and raise verified output starting today. The items below target the five most common causes of schedule blowouts on U.S. jobsites: undefined work packages, unverified daily output, slow RFI cycles, poor material staging, and missing admin ownership. Copy this into your next site brief or morning standup.
Top-priority checklist (copy and use now):
- Break scope into discrete work packages with defined quantities and a single accountable owner per package.
- Set a daily verified-output target by zone and record actual installed quantities at shift end.
- Assign an RFI response target (48 hours is a practical starting point) and track open RFIs by age every morning.
- Define material staging zones before crews arrive; no material lands on-site without a designated laydown location.
- Confirm equipment readiness at the start of each shift; log any downtime with cause code.
- Enter verified progress quantities into your project controls system before the end of each working day.
- Assign an owner to every administrative control (document log, change register, submittal tracker) with a weekly sign-off cadence.
- Run a 15-minute zone walkthrough at shift end to catch rework triggers before they compound overnight.
Who signs off today: The site supervisor confirms verified quantities by zone and records them in the daily log.
Pro Tip: Set the output target in installed units (linear feet of pipe, square feet of cladding, cubic yards of concrete placed), not in labor hours. Hours tell you what you spent; installed units tell you what you built.
Key Takeaways
A construction operational efficiency checklist works only when verified output, named admin owners, and a daily reporting cadence are non-negotiable from day one.
| Point | Details |
|---|---|
| Measure output, not hours | Record installed quantities by zone daily; hours alone cannot show where production is leaking. |
| Assign admin control owners | Every log, register, and tracker needs a named owner with a weekly sign-off before mobilization. |
| Use the operational-efficiency ratio | Divide planned quantity by actual quantity and planned hours by actual hours; flag any ratio below 0.85. |
| Phase the rollout in 30/90/180 days | Pilot on one project first, stabilize KPIs by day 90, then scale with lessons learned. |
| Debecorp CHERP and SiteComm | Cover field ops, daily logs, material tracking, and crew communication to run the checklist digitally. |
Table of Contents
- Why operational efficiency matters on U.S. construction projects
- How do you measure operational efficiency on a construction site?
- What should you lock down before mobilization? Phase 1 planning checklist
- Phase 2 mobilization checklist: what to set up in the first 14 days
- Daily and weekly execution: how to monitor, control, and course-correct
- Phase 4 closeout checklist: punch list, commissioning, and handover
- Which tools support your site operations efficiency checklist?
- How to implement this checklist: a 30/90/180-day rollout plan
- How the checklist maps to contract-administration tasks and U.S. productivity data
- Common mistakes that undo operational efficiency gains
- Risk management strategies that protect operational efficiency
- What the checklist actually looks like on a real jobsite
- CHERP and SiteComm put this checklist to work on your site
- Sources
Why operational efficiency matters on U.S. construction projects
Construction productivity in the United States has been a persistent problem for decades, and the BLS construction labor productivity data through 2024 makes the measurement challenge concrete: output heterogeneity across project types and the partial omission of subcontractor hours mean that headline productivity figures routinely understate the true gap between planned and actual performance. For a PM managing a mixed-trade site, that gap shows up as schedule slippage, cost growth, and rework that nobody budgeted for.
Operational efficiency in construction refers to the ratio of verified productive output to the total resources consumed to produce it. It is not the same as keeping crews busy. A crew can be fully occupied and still produce nothing billable if materials are not staged, if an RFI is blocking the next operation, or if the work package was never clearly defined. That distinction is what makes a construction management checklist worth building around output, not activity.
The downstream effects are real. Rework alone typically consumes a significant share of total project labor on U.S. commercial and industrial projects, and most of it traces back to preventable planning failures: missing constructability reviews, late submittals, and undefined scope boundaries. Crew morale follows the same curve. When workers show up and spend the first hour hunting for materials or waiting on a decision, productivity drops and turnover risk rises.
Stat to know: The U.S. construction sector is one of the largest in the economy, with the U.S. Census construction industry data tracking hundreds of billions in annual spending. Even a modest improvement in site operations efficiency across a portfolio translates to measurable cost savings.
Verified output tracking and site visibility are the two levers with the fastest payback. When a PM can see, by zone, what was installed versus what was planned, course corrections happen in hours rather than weeks. That is the core logic behind every item in this checklist.
How do you measure operational efficiency on a construction site?
The primary KPIs to track are production rate versus baseline, Schedule Performance Index (SPI), rework rate, idle time percentage, and RFI volume with response time. Together, they give you a complete picture of where output is leaking. Tracking verified output rather than hours worked is the critical shift: hours tell you what you consumed, installed quantities tell you what you actually produced.
The operational-efficiency ratio:
Operational Efficiency = (Planned Quantity Installed ÷ Actual Quantity Installed) × (Planned Labor Hours ÷ Actual Labor Hours)
A ratio above 1.0 means you are ahead of plan on both output and labor. Below 0.85 on either dimension is a flag worth escalating.
Worked example (wall cladding installation):
- Planned quantity: 2,400 sq ft per week
- Actual quantity installed: 2,100 sq ft
- Planned labor hours: 160 hours
- Actual labor hours: 175 hours
- Efficiency ratio: (2,400 ÷ 2,100) × (160 ÷ 175) = 1.143 × 0.914 = 1.045
In this case, the crew is slightly ahead on output but consuming more hours than planned. The ratio is above 1.0, but the labor overrun is worth watching. If actual hours hit 190 next week with the same output, the ratio drops below 1.0 and a corrective conversation is overdue.
For labor productivity tracking, the table below shows the minimum KPI set, how to calculate each one, how often to report it, and who owns it.
| KPI | Formula | Reporting frequency | Owner |
|---|---|---|---|
| Production rate vs. baseline | Actual installed qty ÷ planned installed qty | Daily by zone | Site supervisor |
| Schedule Performance Index (SPI) | Earned value ÷ planned value | Weekly | PM |
| Rework rate | Rework hours ÷ total labor hours | Weekly | QA/QC lead |
| Idle time percentage | Idle hours ÷ total shift hours | Daily | Site supervisor |
| RFI volume and response time | Open RFIs by age; avg. days to close | Daily open / weekly trend | PM or field admin |
Flag any KPI that misses its threshold two days in a row. One bad day is noise; two consecutive misses is a pattern.
What should you lock down before mobilization? Phase 1 planning checklist
The planning phase is where most efficiency losses are baked in, long before a crew sets foot on-site. Locking these items before mobilization prevents the cascading delays that no amount of daily monitoring can fix.
Pre-construction checklist:
- Define work packages with quantities, sequence, and a single accountable owner.
- Establish production baselines for each work package (planned units per shift).
- Complete constructability reviews for all major scope items.
- Identify long-lead materials and equipment; set procurement triggers with float buffers.
- Confirm the Project Management Plan (PMP) and Construction Management Plan (CMP) are signed and distributed.
- Set up the document control system: RFI log, submittal tracker, change register, and drawing register.
- Assign owners to all administrative controls with a weekly sign-off cadence.
- Define QA/QC hold points and inspection requirements by trade.
- Confirm communication procedures: who receives what, at what frequency, in what format.
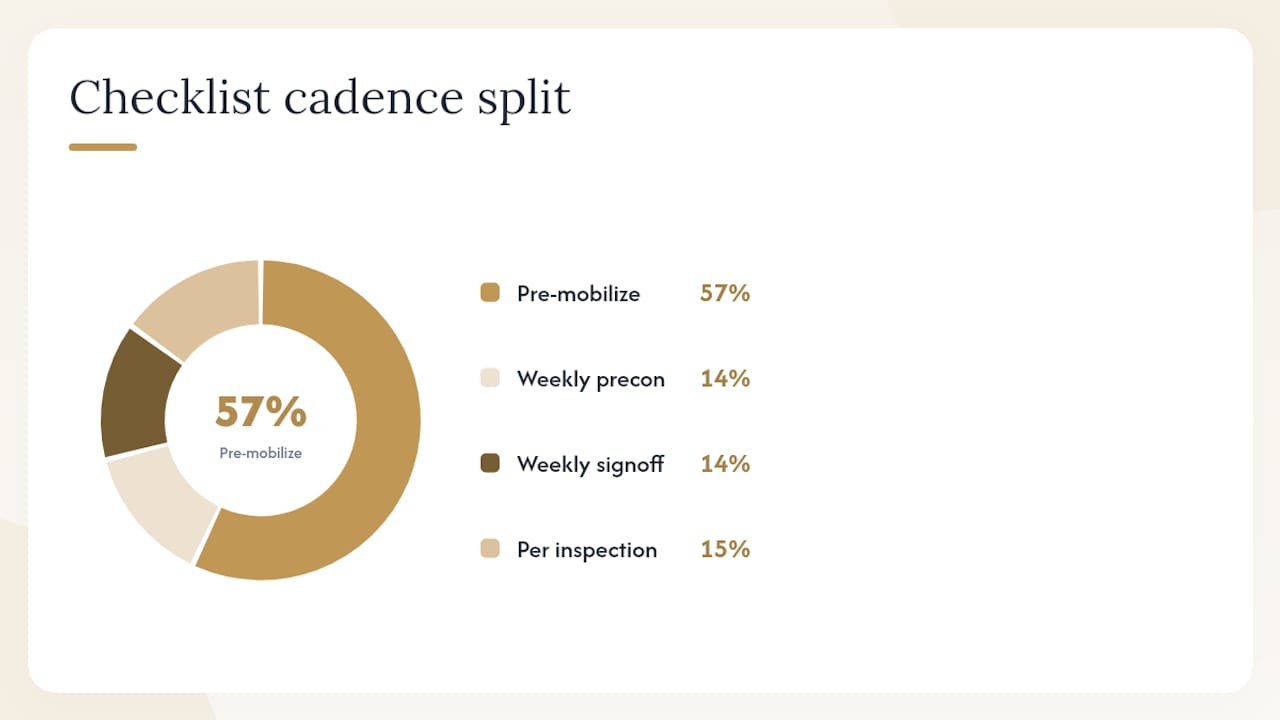
The table below maps each checklist item to its contract-administration reference, the responsible party, and the required cadence.
| Checklist item | Contract-admin reference | Owner | Cadence |
|---|---|---|---|
| Work packages defined | Scope of work / PMP | PM | Pre-mobilization |
| Production baselines set | Schedule baseline | PM + site supervisor | Pre-mobilization |
| Long-lead items flagged | Procurement schedule | Procurement lead | Weekly during precon |
| Document control system live | CMP / documentation procedures | Field admin | Pre-mobilization |
| Admin controls assigned | CMP | PM | Weekly sign-off |
| QA/QC hold points confirmed | QA/QC plan | QA/QC lead | Per inspection trigger |
| Communication procedures distributed | CMP / communications plan | PM | Pre-mobilization |
During precon, escalate any long-lead item with a lead time longer than your schedule float. If the item has zero float, it belongs on the critical path and needs a procurement decision immediately, not at the next monthly meeting.
Pro Tip: Assign every administrative control a named owner before mobilization. “The team” owns nothing. If the RFI log does not have a person’s name on it, RFIs will age without anyone noticing.
Phase 2 mobilization checklist: what to set up in the first 14 days
The first two weeks on-site set the behavioral norms that persist for the rest of the project. A crew that learns to stage materials correctly and log output daily in week one will do it in week twenty. A crew that learns to improvise in week one will improvise forever.
Mobilization checklist (days 1–14):
- Establish and mark site access routes, perimeter controls, and visitor sign-in procedures.
- Define and mark material laydown zones by trade and delivery sequence; post zone maps at the site entrance and in the site office.
- Verify equipment readiness: pre-operation checks completed, maintenance logs current, operator certifications on file.
- Conduct a safety stand-up covering site-specific hazards, PPE requirements, and emergency procedures.
- Complete initial zone assignments for each trade crew.
- Set up the digital daily-log system: confirm all site supervisors can enter verified quantities from a mobile device before end of shift.
- Run a one-hour onboarding session for site admins covering the document control system, RFI log, and daily reporting format.
- Verify inbound material deliveries against the approved submittal and purchase order; the site supervisor signs off on each delivery ticket.
- Establish the first verified production baseline by recording actual output on day 3 and day 7 and comparing to the planned rate.
For inbound material verification: the receiving supervisor checks quantity, specification, and condition against the approved submittal before any material is moved to a laydown zone. Any discrepancy gets logged in the RFI system the same day. Proper material staging also reduces on-site waste generation, which matters both for cost and for compliance with EPA guidance on construction and demolition debris.
Field briefings during mobilization should be short: 10–15 minutes, one topic, one decision. If a briefing runs longer than 20 minutes, it has become a meeting and should be scheduled separately. Mobile attendance tracking from day one gives you a verified crew-deployment record that ties directly to your production baseline.
Daily and weekly execution: how to monitor, control, and course-correct
The daily routine is where the checklist either lives or dies. Most sites have a plan; far fewer have a daily verification habit that catches deviations before they compound.
Daily routine (every shift):
- Verify actual output by zone against the daily target; record in the digital log before shift end.
- Capture verified installed quantities (not estimated, not rounded up).
- Log all open RFIs with current status and days open.
- Record any delays with a cause code (material, equipment, weather, design, labor).
- Flag any zone where output fell below 80% of target and assign a corrective action owner.
Weekly dashboard contents (reviewed by PM and operations lead every Monday morning):
- SPI by work package
- Rework rate trend (last 4 weeks)
- RFI aging report (open items by days outstanding)
- Idle time percentage by trade
- Cumulative production rate vs. baseline curve
Centralizing field updates into a single dashboard eliminates the version-control problem that plagues sites running updates through email and spreadsheets.
Escalation flow: When a KPI misses its threshold for two consecutive days, the site supervisor notifies the PM with the cause code and a proposed corrective action. The PM has 24 hours to approve, modify, or escalate to the operations lead. If the same KPI misses for five consecutive days, the issue goes to a formal corrective-action review with the subcontractor and a revised recovery schedule.
| Trigger | Escalation level | Response time | Owner |
|---|---|---|---|
| Output below 80% of target, 2 days | Site supervisor to PM | 24 hours | PM |
| SPI below 0.90 for one week | PM to operations lead | 48 hours | Operations lead |
| RFI open more than 5 days | PM to design team | Same day | PM |
| Rework rate above 5% for 2 weeks | PM to QA/QC lead + subcontractor | 48 hours | QA/QC lead |
Pro Tip: Use zone-level output data to sequence trade deployment. That one decision, made consistently, is worth more than any weekly dashboard review.
Phase 4 closeout checklist: punch list, commissioning, and handover
Closeout is where projects that ran well on-site lose weeks to missing documents, unresolved RFIs, and incomplete commissioning records. The items below prevent the most common hold-ups.
Punch-list template (copy and use):
- Walk each zone with the owner’s representative; log every deficiency with location, description, and responsible trade.
- Assign a completion date and a sign-off owner to every punch-list item.
- Verify that all RFIs are closed or formally deferred with owner acknowledgment.
- Confirm all test reports (pressure tests, electrical tests, commissioning certificates) are complete and filed.
- Collect all spare parts, attic stock, and special tools specified in the contract.
- Assemble the as-built drawing package; verify it reflects all field changes.
- Compile the O&M manual package: equipment schedules, maintenance procedures, warranty certificates, and vendor contacts.
- Obtain the owner’s written acceptance of each system before final payment is triggered.
Federal O&M best practices guidance outlines the commissioning and handover standards that translate directly to these checklist items, particularly for mechanical, electrical, and plumbing systems where incomplete commissioning records create long-term liability.
Required handover documents:
- Record drawings (as-builts) stamped and signed
- Commissioning certificates for all major systems
- Test and inspection reports
- Spare parts and attic stock inventory
- Warranty certificates with start dates and contact information
- O&M manuals organized by system
Acceptance sign-off flow: The PM presents the complete handover package to the owner’s representative. The owner has a defined review period (typically 10–14 days per contract). Final payment is released only after written acceptance of the punch-list completion and the full document package. Avoid the most common hold-up: missing O&M documentation.
Which tools support your site operations efficiency checklist?
The checklist works on paper. It works significantly better when the data flows automatically from the field into a single system that the PM can review without chasing five different spreadsheets.
The tool categories you need to operationalize a construction management checklist are:
- Field ops and daily logs: time and attendance, verified output entry, safety compliance, crew deployment
- Production tracking: installed quantities by zone, production rate vs. baseline, rework logging
- BIM and model coordination: RFI and submittal management tied to the model
- Schedule and earned value: SPI, cost performance index, schedule updates
- Equipment and material tracking: delivery verification, equipment maintenance logs, laydown zone management
Where CHERP and SiteComm fit: Debecorp’s CHERP platform covers the field ops layer directly: time and attendance, daily logs, material and equipment tracking, safety compliance, role-based admin, and per-trade field calculators. SiteComm handles the crew communication and community layer, including jobsite chat, peer recognition, and worker-owned social features. Together, they close the visibility gap between what happens on-site and what the PM sees in the project controls system. Field worker productivity tools in this category are most effective when they are built around how tradespeople actually work, which is exactly the design philosophy behind both platforms.
The integration that matters most is the data bridge between your field ops platform and your project controls system. Daily verified quantities entered in CHERP should flow automatically into your schedule update, not require manual re-entry by a field admin.
| Tool category | Primary function | Checklist sections supported |
|---|---|---|
| Field ops (CHERP) | Time & attendance, daily logs, material/equipment tracking | Mobilization, execution, closeout |
| Crew communication (SiteComm) | Jobsite chat, peer recognition, crisis support | All phases |
| BIM coordination | RFI and submittal management | Planning, execution |
| Schedule and EVM | SPI, CPI, schedule updates | Execution, closeout |
| Equipment tracking | Maintenance logs, utilization rates | Mobilization, execution |
Pro Tip: Eliminate duplicate entry from day one. If a supervisor enters verified quantities in the field app, that number should not need to be re-entered in the project controls system. Any manual re-entry step is a data-quality risk and a time sink. Map the integration before mobilization, not after the first monthly report.
How to implement this checklist: a 30/90/180-day rollout plan
A checklist that lives in a PDF and never gets deployed is just documentation. The rollout below is built for a single-project pilot that can qualify for scale across a portfolio.
Roles and responsibilities:
- PM: owns the checklist, sets KPI thresholds, reviews the weekly dashboard, approves corrective actions.
- Site supervisor: executes the daily routine, enters verified quantities, flags deviations.
- Operations lead: reviews weekly dashboard with PM, escalates systemic issues, owns the 90-day review.
- Procurement lead: owns long-lead item tracking and inbound material verification.
- Field admin: maintains the document control system, RFI log, and submittal tracker; assembles the O&M package.
- QA/QC lead: owns rework rate tracking, hold-point inspections, and punch-list management.
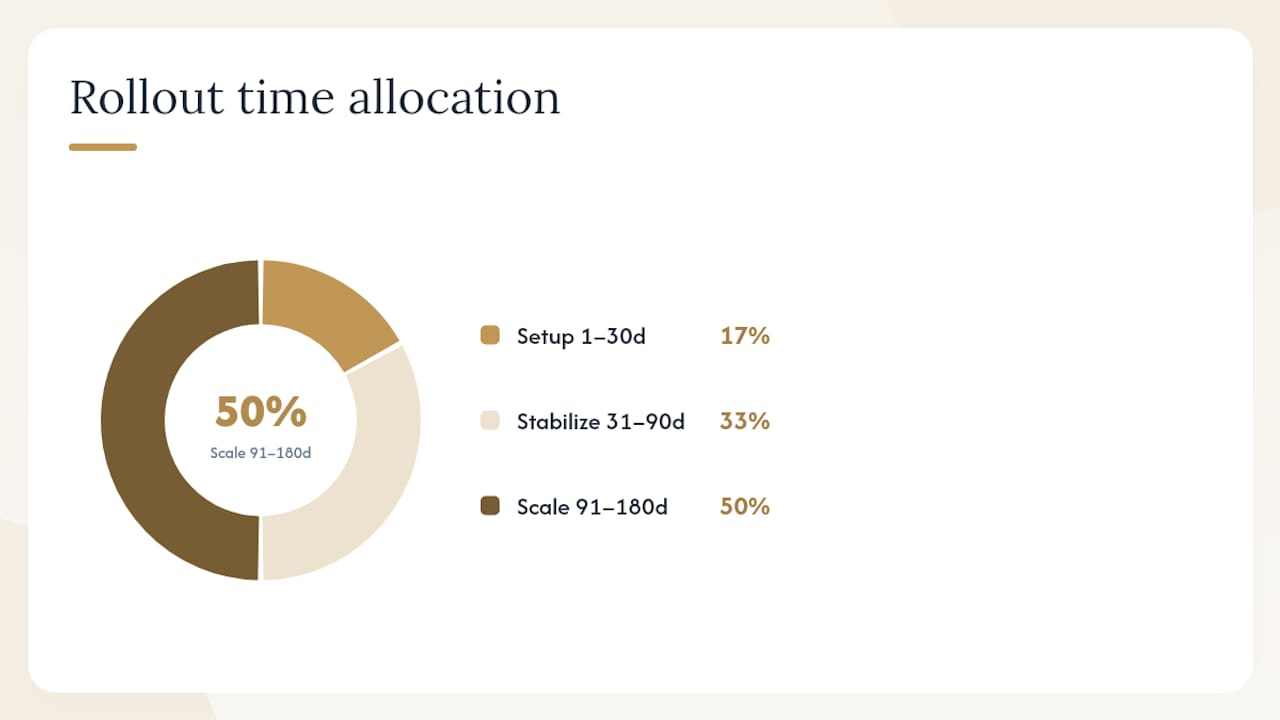
30/90/180 implementation plan:
- Days 1–30 (pilot setup): Select one project or one phase. Deploy the digital daily-log system. Train site supervisors on verified output entry. Establish production baselines by day 7. Run the weekly dashboard for the first time by day 14. Measure baseline KPIs for 30 days.
- Days 31–90 (stabilize and measure): Review KPI trends from the pilot. Identify the two or three checklist items with the highest variance and address root causes. Confirm admin control ownership is working. Assess whether the integration between field ops and project controls is eliminating duplicate entry. Prepare a one-page pilot summary for stakeholders, citing CII best practices on project-control implementation.
- Days 91–180 (scale): Roll out to additional projects using the pilot’s lessons. Standardize the checklist template across the portfolio. Assign a portfolio-level operations lead to review cross-project KPI trends monthly. Revisit tool configurations and integration mappings.
Typical cost drivers to budget:
- Software licenses (field ops platform, project controls integration)
- Mobile devices for field supervisors (if not already deployed)
- Training hours (estimate 4–8 hours per site supervisor for initial onboarding)
- Integration setup effort (typically a one-time configuration cost)
- Field admin time for document control setup (typically 8–16 hours pre-mobilization)
For the change-management side of a tech rollout, the change management in construction tech guide covers adoption resistance and phased rollout tactics that apply directly to this implementation plan. PMI’s goal-setting guidance also offers a useful framework for structuring the 30/90/180 milestones and qualifying readiness before scaling.
How the checklist maps to contract-administration tasks and U.S. productivity data
Every item in this checklist has a contract-administration counterpart. That mapping matters because it gives PMs a defensible rationale for each checklist requirement when presenting to owners, GCs, or subcontractors who push back on the overhead.
| Checklist item | Contract-admin task | Supporting reference |
|---|---|---|
| Work packages defined | Scope documentation, PMP | CMP / project scope |
| Production baselines | Schedule baseline, progress payments | Contract schedule |
| RFI log with response targets | Communications procedures, documentation | CMP |
| Admin control ownership | Document control, change management | CMP / change register |
| QA/QC hold points | Testing and inspection procedures | QA/QC plan |
| Verified output entry | Progress payment documentation | Schedule of values |
| O&M package assembly | Closeout documentation | Contract closeout requirements |
U.S. productivity context: BLS construction labor productivity measures through 2024 carry an important caveat: they exclude some subcontractor hours and vary significantly by construction type, which means industry-level productivity figures can mislead a PM trying to benchmark a specific project. The practical implication is that your own verified output data, collected consistently at the zone level, is a more reliable benchmark than any industry average.
Stat to know: The U.S. Census construction industry release tracks the scale of the sector, providing context for why even incremental efficiency gains across a portfolio represent substantial dollar value. For stakeholder briefings, cite the sector’s total annual spending alongside your project-level efficiency ratio to frame the business case.
Sample stakeholder justification language: “This checklist formalizes the contract-administration controls already required by our CMP and ties them to daily verified output tracking. The approach is consistent with CII field productivity best practices and addresses the measurement gaps identified in BLS construction productivity data. Implementing it on this project reduces rework risk, accelerates RFI cycles, and gives ownership real-time visibility into schedule performance.”
Common mistakes that undo operational efficiency gains
Most efficiency programs fail not because the checklist was wrong, but because one of these patterns took hold before anyone noticed.
-
Measuring hours instead of output. Hours tell you what you spent; they do not tell you what you built. If your daily report shows 160 labor hours and no installed quantities, you have an activity log, not a production record. Fix: add a “verified installed quantity” field to every daily log entry and make it mandatory before the log can be submitted.
-
Running weekly reporting on daily problems. A zone that falls below 80% of target on Monday and gets reviewed on Friday has lost four days of recovery time. Fix: set a daily threshold alert and assign a same-day response owner.
-
Missing admin control ownership. If the RFI log, change register, and submittal tracker do not have named owners with a weekly sign-off requirement, they will drift. Fix: add admin control ownership to the pre-mobilization checklist and review it in the first weekly dashboard meeting.
-
Inconsistent work methods across crews. When two crews doing the same scope use different sequences and materials-handling approaches, comparing their output is meaningless and rework risk doubles. Lean Construction Institute methods, particularly standard work instructions and work packaging, are the most reliable way to reduce this variability.
-
Ignoring the visibility gap. Planning efficiency and process efficiency are necessary but not enough. The gap between what the project model shows and what is actually happening on-site is where most surprises originate. Fix: run a daily zone walkthrough and enter verified quantities before the shift ends, every day, without exception.
-
Treating closeout as a phase, not a parallel process. O&M manual assembly, as-built updates, and commissioning preparation should start at 80% completion. Starting at substantial completion guarantees a documentation scramble. Fix: assign the field admin to O&M assembly at the 80% milestone and track it as a KPI.
Spotting a visibility gap: If your PM’s weekly report and your site supervisor’s daily log show different numbers for the same scope item, you have a visibility gap. The corrective action is simple: trace the discrepancy to its source (manual re-entry error, different quantity basis, or unreported rework), fix the data path, and add a daily reconciliation step.
Risk management strategies that protect operational efficiency
Risk management and operational efficiency are not separate disciplines on a construction site. Every unmitigated risk is a future efficiency loss, and the checklist items above are, in large part, risk controls in disguise.
Planning phase risks: Undefined scope boundaries and missing constructability reviews are the two highest-probability risks at this stage. Both translate directly into RFI volume during execution and rework during closeout. The mitigation is the pre-construction checklist: work packages defined, baselines set, long-lead items flagged. Workforce planning is a related risk at this stage; crews that are not sized and sequenced correctly during planning create idle time and overtime during execution.
Mobilization risks: Material delivery failures and equipment readiness gaps are the dominant risks during the first 14 days. The inbound material verification procedure and the equipment readiness check in the mobilization checklist are direct mitigations. Improper material staging also creates waste and safety hazards, both of which carry cost and schedule consequences.
Execution risks: RFI delays, design changes, and subcontractor performance gaps are the primary execution-phase risks. The daily RFI aging report and the escalation flow in the execution checklist address all three. A design change that is not logged in the change register within 24 hours becomes a scope dispute at closeout. The change register, with a named owner and a daily update cadence, is a risk control.
Closeout risks: Missing O&M documentation, unresolved RFIs, and incomplete commissioning are the three most common causes of delayed final payment. Federal O&M best practices provide the commissioning and handover standards that define what “complete” looks like for mechanical and electrical systems.
Cross-phase risk: Labor turnover is a risk that cuts across all phases. When a key supervisor leaves mid-project, the institutional knowledge about zone assignments, work methods, and open issues leaves with them. Digital daily logs and a centralized document control system are the mitigation: the information lives in the system, not in one person’s head.
What the checklist actually looks like on a real jobsite
The hardest part of deploying any checklist is not the content. It is the initial period, when the crew is still deciding whether this is a real expectation or just another piece of paper from the office.
The checklist items that fail most often in early deployments are the ones that require a behavior change at shift end: entering verified quantities into a digital system when the crew is tired and ready to leave. The fix is not a longer training session. It is making the entry fast enough (under two minutes per zone) and visible enough (the PM reviews it before 8 AM the next morning and responds) that supervisors understand it is actually being used.
The checklist items that deliver the fastest payback are the ones that prevent the first rework cycle. A constructability review that catches a clash between mechanical and structural before mobilization saves more time than any corrective-action flow during execution. The planning checklist is where the efficiency is won or lost; the execution checklist is where it is protected.
One honest admission: the administrative control ownership item is the one most organizations skip. Assigning a named owner to the RFI log and the change register feels like overhead until the first time a 30-day-old RFI surfaces in a dispute. Make it explicit, make it a checklist item, and review it weekly.
The bottom line is the same as the BLUF at the top: verified output by zone, daily, with a named owner for every administrative control. Everything else in this checklist supports those two habits.
CHERP and SiteComm put this checklist to work on your site
Running this checklist manually is possible. Running it consistently across multiple projects, with verified data flowing from the field to the PM in real time, requires a platform built for how tradespeople actually work on-site.

CHERP, Debecorp’s field operations platform, covers the daily log, time and attendance, material and equipment tracking, safety compliance, and role-based admin that the execution and mobilization checklist items require. SiteComm handles crew communication, jobsite chat, and peer recognition, keeping the team connected without the noise of consumer messaging apps. Both platforms are built from the ground up with input from tradespeople, which means the UX is fast enough that a supervisor can enter verified quantities in under two minutes at shift end.
Three concrete outcomes PMs report when running this checklist through CHERP and SiteComm: verified daily output is captured and visible to the PM before the next morning’s standup; RFI response cycles shorten because the field log and the communication layer are in the same system; and the single source of truth eliminates the version-control disputes that slow down progress payment approvals.
Onboarding is straightforward: site admins are typically up and running within one day, and the platform integrates with common project controls systems to eliminate duplicate entry. See the full CHERP and SiteComm capabilities and request a demo to walk through how the checklist maps to the platform’s features.
Sources
The sources below back the checklist items, KPI formulas, and contract-administration mapping in this article. PMs can use them to verify claims, deepen their understanding of specific topics, or cite them in stakeholder briefings.
- BLS: Construction labor productivity highlights
- EERE: Operations & Maintenance best practices (OM_5)
- EPA: Construction and demolition debris facts and figures
- U.S. Census: Construction industry release (C30)