
Run short, frequent, anonymous pulses that leaders visibly act on — that single rule covers more ground than any survey platform or question bank. The most effective programs combine a short quarterly pulse with one deeper annual baseline, protect anonymity rigorously, and close the loop with manager-led action before the next survey launches.
Core checklist before you design a single question:
- Purpose first. Define one business question the survey must answer (turnover risk, safety culture, post-reorg morale) before writing any items.
- Keep it short. Pulse surveys use a handful of questions; annual baseline surveys have a deeper set of targeted questions. Longer is not necessarily more rigorous.
- Protect anonymity. Never segment groups smaller than five people. State clearly who sees raw data.
- Enable managers. Give every manager a script, two priority actions, and time to run a team conversation.
- Close the loop. Share themes within 2–3 weeks and start at least one visible fix within the month.
Gallup’s research makes the stakes plain: surveys alone change nothing. Change happens when leaders interpret results and take visible, transparent action. eNPS (Employee Net Promoter Score) and a short Employee Satisfaction Index (ESI) are the two metrics worth tracking from day one.
Pro Tip: Before launch, test your survey with five people from different roles. You’re not checking grammar — you’re checking whether it feels safe to answer honestly.

Table of Contents
- How do you design a worker satisfaction survey that gets honest answers?
- Pulse vs. baseline: how often should you actually survey?
- How do you get more workers to actually complete the survey?
- How do you turn survey scores and comments into priorities managers can act on?
- What does closing the feedback loop actually look like?
- How do you give managers what they need to lead team follow-ups?
- Which metrics should you track, and what does improvement look like?
- U.S. legal, privacy, and ethical considerations for employee surveys
- Ready-to-use survey templates for baseline and pulse
- Key Takeaways
- What actually works for trades teams in the field
- CHERP & SiteComm: built for field teams who need faster follow-through
- Useful sources and further reading
How do you design a worker satisfaction survey that gets honest answers?
The most reliable structure pairs a short Likert-scale index (3–5 scored items) with one or two open-ended questions. Likert items give you trendable numbers; open text tells you why the numbers moved.
Mixing question types — Likert scales for trend tracking plus open-ended questions for context — is a design standard for good reason. Scores without comments leave you guessing at causes. Comments without scores make it hard to track progress.
Question-count guidance:
- Baseline survey: 20–25 questions, completable in under 12 minutes.
- Pulse survey: 6–8 questions, completable in under 3 minutes.
Phrasing rules matter as much as count. “Do you feel supported by your manager?” lands better than “Rate your leader’s coaching capability.” Avoid double-barreled questions (“Do you feel safe and respected at work?”) — they produce uninterpretable answers. For sensitive demographic items, always include a “Prefer not to answer” option; that single choice can meaningfully increase completion rates.
Design for mobile-first, one question per screen, with a visible progress bar. For field and trades teams, this is not optional.
Sample questions by type:
- Likert: “I have what I need to do my job well.” (1 = Strongly Disagree, 5 = Strongly Agree)
- eNPS: “How likely are you to recommend this company as a place to work?” (0–10 scale)
- Open text: “What one change would most improve your day-to-day work?”
Pro Tip: Never ask about two things in one question. If you catch yourself writing “and” in a survey item, split it.
Pulse vs. baseline: how often should you actually survey?
The right cadence is quarterly short pulses plus one annual deep survey. That pattern gives you enough trend data to act on without burning out respondents or outpacing your team’s ability to respond.
Pulse surveys should stay at 5–10 questions; annual surveys can go deeper. The governing rule: only survey as often as you can act. A monthly pulse with no visible follow-through trains employees to stop answering.
A working listening calendar also requires that previous results were communicated before the next survey launches. Skipping that step is one of the fastest ways to tank response rates.
Sample annual cadence:
- Q1: Annual baseline with a moderate number of questions and a defined response window
- Q2: Pulse on top themes from baseline with a brief set of questions and shorter response window
- Q3: Pulse on Q2 actions and new items similarly brief
- Q4: Pulse with a preview of next year’s baseline themes, keeping the pulse short
For event-triggered situations (a reorg, a safety incident, a leadership change), run a short pulse within two weeks of the event rather than waiting for the scheduled cycle.
How do you get more workers to actually complete the survey?
For small organizations, survey everyone. For larger ones, a stratified random sample across departments and shifts reduces fatigue while still surfacing the same patterns. Either way, clear communication about purpose and anonymity does more for response rates than any reminder tactic.
Practical tactics that move the needle:
- Manager endorsement at team meetings before launch
- Two to three reminders spaced across the survey window (not daily)
- Mobile access and, for offline field workers, tablet kiosks or paper-to-digital options
- A stated completion time (“This takes under 3 minutes”) in every communication
- Progress bars inside the survey itself
For trades and field teams, mobile-first survey delivery is the single biggest participation lever. Workers who can’t complete a survey on their phone during a break simply won’t complete it.
Never report subgroup data for groups smaller than five people. Even technically anonymous small cells make identification likely and destroy trust.
Pro Tip: Send your survey launch message from a direct manager, not HR. Workers are more likely to open and complete it when the ask comes from someone they report to.
How do you turn survey scores and comments into priorities managers can act on?
Start with a simple workflow: build your ESI from 3–5 core Likert items, segment where group sizes allow, extract themes from open text, then prioritize by business impact and feasibility.
The four-stage feedback loop — collect, analyze into themes, act visibly, re-measure — is the operational model that keeps trust intact. Abandoning the “act” stage collapses honesty in future surveys.
Reporting template for leaders:
| Metric | This Period | Last Period | Action Owner |
|---|---|---|---|
| ESI (0–100) | — | — | HR |
| eNPS | — | — | HR |
| Response rate | — | — | HR |
| Top theme (needs work) | — | — | Manager |
| Hygiene action completed | Yes / No | — | Manager |
Safe segmentation rules: report by team, tenure, or role only when each subgroup has at least five respondents. Over-interpreting a three-person subgroup is a common and costly mistake.
For open-text analysis, read every comment before categorizing. Basic thematic grouping (recognition, workload, communication, tools) is enough for most teams. The goal is to find the two or three themes that appear repeatedly, not to catalog every grievance.
Pro Tip: Build your ESI from the same 3–5 questions every cycle. Changing core items mid-program breaks your trend line and forces you to start over.
What does closing the feedback loop actually look like?
Share themes within 2–3 weeks of survey close. Start at least one visible fix within the month. That pace matters more than perfection.
The four-stage loop only works if the “act” stage is public. A survey with no visible follow-up teaches employees their honesty was wasted. Acting fast on hygiene issues (broken equipment, unclear schedules, missing PPE) while handling structural issues (pay, career paths) with transparent timelines is the approach that preserves credibility.
When communicating results, use attribution language that proves you listened: “You told us the morning briefings ran too long. Starting next week, they’re capped at 10 minutes.” That specificity is what separates a real listening program from a compliance exercise.
Pro Tip: Separate your action plan into two tracks: hygiene fixes (days to weeks, visible wins) and structural changes (months, with a roadmap). Communicate both, but never let the structural timeline become an excuse to delay the hygiene fixes.
How do you give managers what they need to lead team follow-ups?
Managers must lead team-level follow-ups. Give them a short script, two priority actions to experiment with, and protected time to run the conversation.
Managers are the primary drivers of engagement and need tools, time, and specific talking points to run team discussions productively. Without that support, survey results sit in a dashboard and nothing changes.
Manager conversation script (15-minute team meeting):
- “Here’s what we heard from the team this cycle.” (Share 2–3 themes, no attribution.)
- “Here’s what we’re going to do about the top issue.” (Name one specific action.)
- “What questions do you have, and what did we miss?”
Three diagnostic questions for the team meeting:
- “What’s one thing that would make your day-to-day easier right now?”
- “What’s working well that we should protect?”
- “What’s one thing you wish leadership understood better?”
Operational support managers need: access to their team’s aggregated data (not individual responses), a one-page summary of themes, a small discretionary budget for hygiene fixes, and 30 minutes of protected time.
Pro Tip: Train managers to receive upward feedback without defensiveness: pause, ask one clarifying question, thank the employee, and report back later. That receiving skill keeps the upward channel open.
Which metrics should you track, and what does improvement look like?
Prioritize four metrics: response rate, ESI, eNPS, and a hygiene-action completion rate. That dashboard tells you whether people are participating, how they feel, whether they’d recommend the organization, and whether you’re actually fixing things.
Metric definitions:
- Response rate: Percentage of invited employees who complete the survey, with aims to maximize participation.
- ESI: Average score across core Likert items, normalized to a 0–100 scale; trends are more important than absolute numbers.
- eNPS: Calculated as promoters minus detractors on a 0-10 scale.
- Hygiene-action completion rate: Proportion of quick fixes completed before the next cycle, indicating follow-through.
For the first 6–12 months, benchmark internally. A 5-point ESI improvement cycle-over-cycle is a meaningful signal. Chasing external benchmarks before you have two cycles of your own data is a distraction. Connecting survey results to turnover data gives you the clearest picture of whether the program is working.
Pro Tip: Report eNPS with the open-text “why” responses attached. The number alone tells you nothing; the comments tell you everything.
U.S. legal, privacy, and ethical considerations for employee surveys
Protect anonymity, follow minimum group-size reporting (no segmentation below five respondents), and document who can access raw data. Those three rules cover most of the risk.
U.S.-specific considerations:
- Store raw survey responses in a system with role-based access controls. HR leadership and the survey administrator should be the only people with access to individual response data.
- For sensitive topics (safety concerns, discrimination, harassment), use fully anonymous collection with no unique survey links that could be traced back to individuals.
- Include “Prefer not to answer” on all demographic questions (race, gender, disability status). This is both an ethical standard and a completion-rate tactic.
- Document your data retention policy before launch. Most organizations retain aggregated results indefinitely and delete raw responses after 12–24 months.
- Design questions to be inclusive and non-discriminatory. Avoid phrasing that assumes a single family structure, physical ability, or cultural background.
Pro Tip: Never store open-text responses in a shared folder or email thread. Raw comments can deanonymize respondents even when scores are aggregated. Keep them in a locked system and limit access strictly.
This article is general information, not legal advice. Confirm your data-handling practices with a qualified employment attorney or your organization’s privacy officer.
Ready-to-use survey templates for baseline and pulse
Use the 20–25 question baseline once a year for a full diagnostic. Use the 6–8 question pulse quarterly to track movement on your top themes.
Template overview:
| Question | Type | Purpose | Maps to |
|---|---|---|---|
| “Overall, how satisfied are you in your current role?” | Likert | Baseline sentiment | ESI |
| “I have what I need to do my job well.” | Likert | Resources/tools | ESI |
| “I get useful feedback from my manager.” | Likert | Manager support | ESI |
| “My workload feels manageable most weeks.” | Likert | Wellbeing/burnout risk | ESI |
| “I feel safe sharing an opinion that differs from others.” | Likert | Psychological safety | ESI |
| “How likely are you to recommend this company as a place to work?” | eNPS (0–10) | Loyalty/advocacy | eNPS |
| “What one change would most improve your day-to-day work?” | Open text | Theme extraction | Action categories |
| “What’s working well that we should protect?” | Open text | Positive reinforcement | Action categories |
Pulse survey (6 questions): Items 1, 3, 4, 6, 7, and one rotating item tied to the current action focus.
Baseline survey (20–25 questions): All eight above plus items covering growth opportunities, compensation fairness, inclusion, communication clarity, and role clarity.
Sample launch communication: “We’re running a short [3-minute / 12-minute] survey to understand what’s working and what needs attention. Your responses are anonymous — no individual answers are shared with managers or leadership. Results will be shared with the whole team within three weeks. [Survey link]”
Reporting dashboard (one-pager): ESI trend chart, eNPS score with comment themes, top three positive themes, top three themes needing action, committed actions with owners and deadlines, and completion status from last cycle.
Pro Tip: Rotate 2–3 questions between pulses to keep surveys fresh while keeping your core 3–5 ESI items constant. That way you can explore new topics without breaking your trend line.
Key Takeaways
Effective worker satisfaction survey programs combine short, frequent pulses with one annual baseline, protect anonymity rigorously, and require manager-led action before the next survey cycle begins.
| Point | Details |
|---|---|
| Design for brevity and trust | Use 6–8 questions for pulses and 20–25 for baselines; always protect anonymity and never segment groups below five people. |
| Match cadence to action capacity | Run quarterly pulses plus one annual deep survey; only survey as often as your managers can visibly respond. |
| Track four core metrics | Monitor response rate, ESI, eNPS, and hygiene-action completion rate every cycle. |
| Close the loop publicly | Share themes within 2–3 weeks and start at least one visible fix within the month to rebuild trust before the next survey. |
| Debecorp’s CHERP & SiteComm | Built for field teams, these platforms support mobile survey delivery and manager follow-through directly on the jobsite. |
What actually works for trades teams in the field
The single practical rule for trades and field teams: make surveys mobile, respect shift schedules, and act fast on hygiene fixes. Everything else is secondary.
Office-based survey programs assume workers have desk time, email access, and a quiet moment to reflect. Field teams have none of that. A foreman-led 10-minute team check-in at the start of a shift, paired with a QR-code link to a 6-question mobile survey, gets better participation than any email reminder campaign. Tablet kiosks at the job trailer work well for crews without personal smartphones.
Quick recognition wins matter disproportionately in trades contexts. When a crew flags that the break area lacks shade and a canopy appears within two weeks, that single visible fix does more for survey credibility than a polished results presentation. Workers on jobsites are skeptical of corporate processes. Fast, concrete action is the only proof that the survey was worth their time.
Worker satisfaction in trades also connects directly to safety outcomes. Teams with higher satisfaction scores tend to report hazards earlier and follow safety protocols more consistently, which means the survey program pays dividends well beyond engagement scores. That connection is worth making explicit to leadership when you’re building the business case for the program.
CHERP & SiteComm: built for field teams who need faster follow-through
Most survey tools were designed for office workers. Debecorp built CHERP and SiteComm from the ground up with tradespeople in mind, which means mobile-first delivery, shift-aware scheduling, and manager messaging that reaches crews where they actually work.
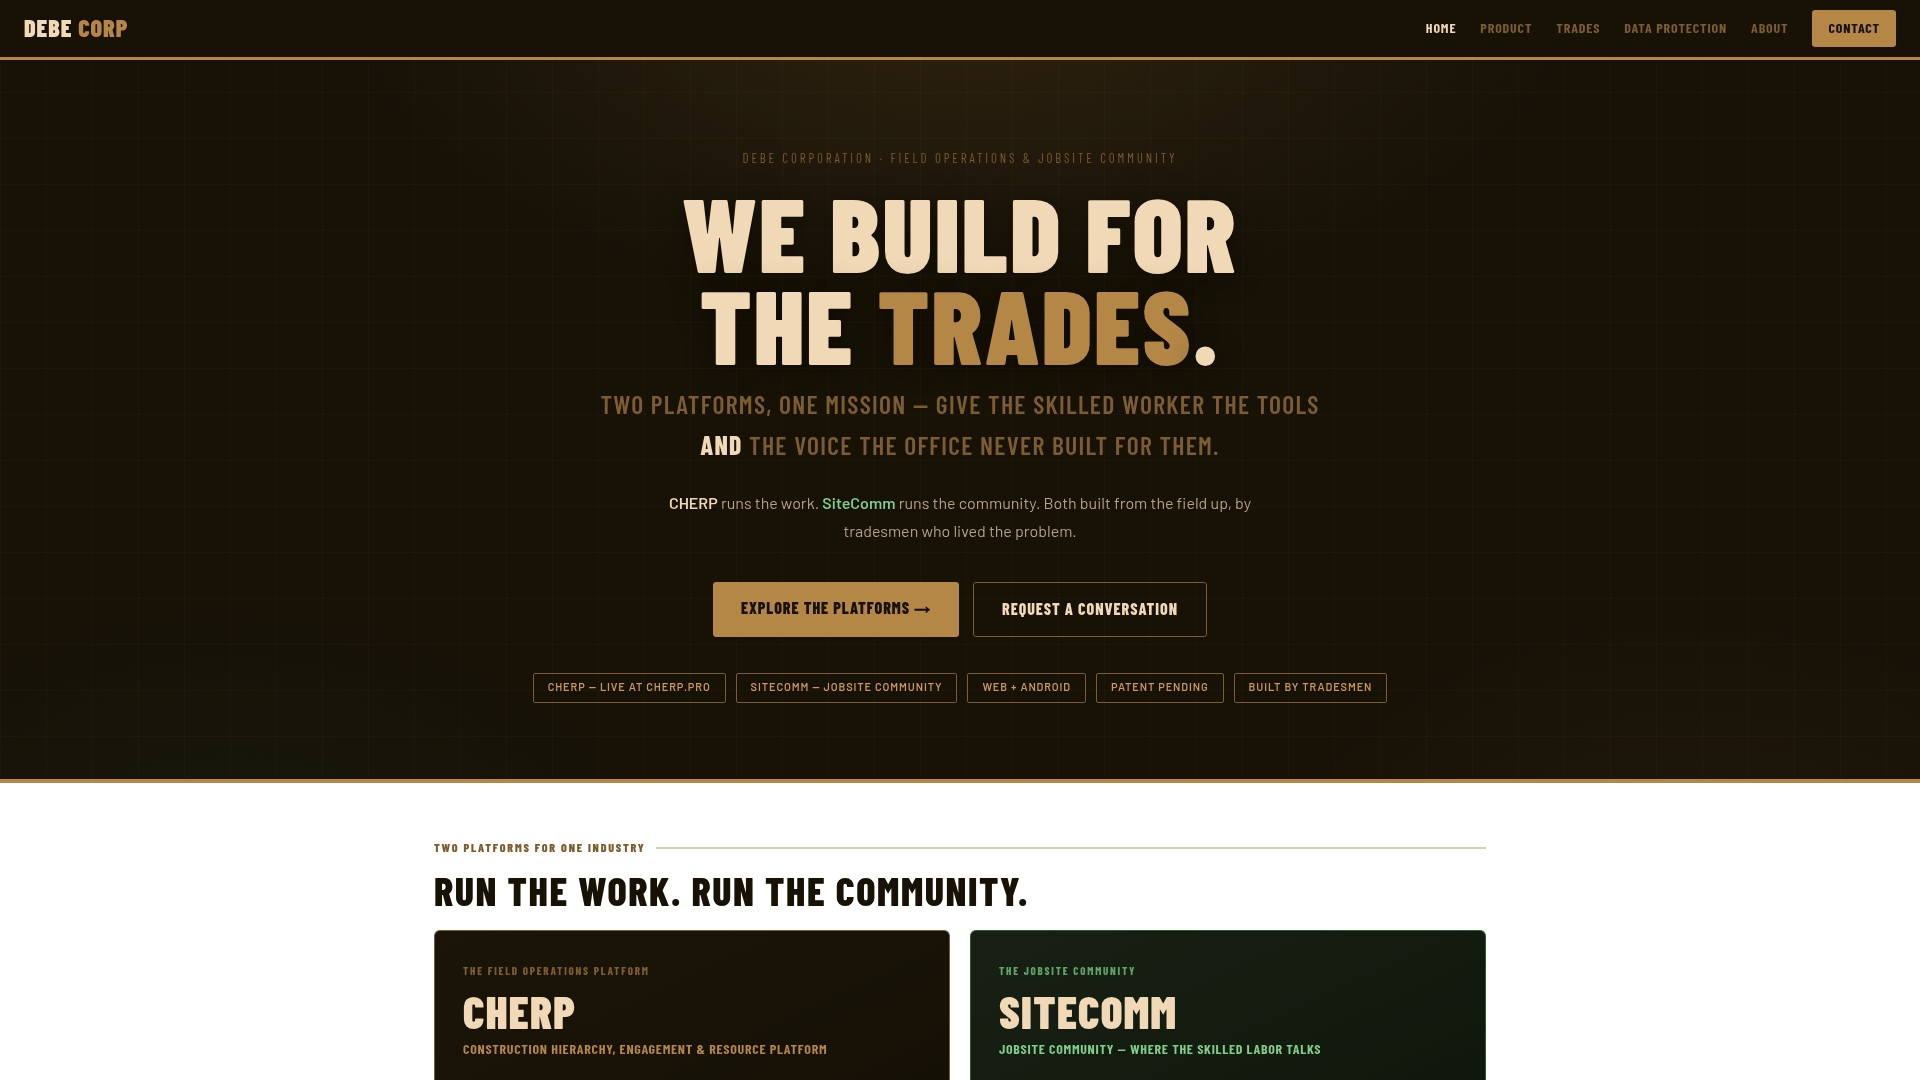
CHERP handles field operations including time and attendance, daily logs, and safety compliance, so survey distribution fits naturally into the same workflow foremen already use. SiteComm handles team messaging, giving managers a direct channel to share results and commit to actions without waiting for an all-hands meeting. For distributed crews across multiple sites, that speed is the difference between a feedback loop that works and one that stalls.
If you’re running satisfaction surveys for a trades team and losing participation to access barriers or slow follow-through, explore CHERP & SiteComm to see how field-native tools change the equation.
Useful sources and further reading
These are the primary sources and authoritative references used to build this article. Each is worth bookmarking if you’re building or refining a survey program.
- Gallup — Workplace Employee Surveys: The definitive case for why action and manager accountability matter more than the survey instrument itself.
- SurveyMonkey — Employee Satisfaction Surveys Guide: Practical guidance on pulse length, cadence, and the link between question count and completion rates.
- Customer Experience Magazine — Employee Satisfaction Survey: Covers question design, eNPS framing, anonymity best practices, and the continuous listening model.
- Vantage Circle — Employee Feedback: Strong on the hygiene vs. structural feedback distinction and building a feedback culture.
- BambooHR — Best Practices for Employee Feedback: Industry insight on the link between frequent manager feedback and engagement.
- Formbricks — Employee Satisfaction Survey Questions: Covers minimum subgroup size rules and anonymity protection in survey design.
- Formroyale — Employee Survey Best Practices: Design recommendations for mixing question types and maintaining anonymity.
- Zalaris — How to Measure Employee Satisfaction: Balancing depth and completion rates across baseline and pulse survey types.
- CIPD — Performance Feedback Evidence Review: Academic evidence base for feedback quality, manager training, and two-way communication.
When selecting tools or benchmarking data, prioritize sources that align with U.S. privacy practices and, for trades teams, platforms designed for field access rather than office environments. Rocky Mountain Underground is one example of a field-operations contractor whose context illustrates the practical constraints trades HR teams navigate daily.