
Worker satisfaction in skilled trades is defined as the degree to which tradespeople find their work conditions, compensation, relationships, and daily operations meet their expectations. The standard industry term for tracking this systematically is employee satisfaction measurement, and it uses tools like the Employee Satisfaction Index (ESI) and the Employee Net Promoter Score (eNPS) alongside behavioral signals specific to jobsite environments. To measure worker satisfaction in trades effectively, employers need more than an annual survey. Higher job satisfaction among licensed skilled trades professionals reduces turnover intention by 53%. That single figure shows how much a structured measurement program can protect your workforce and your bottom line.
What are the key metrics to measure worker satisfaction in trades?
The ESI is the most direct quantitative tool for assessing how workers feel about their jobs. ESI scores above 70 indicate a healthy workforce, with most organizations targeting a range of 75–85. The ESI uses three questions scored on a 0–100 scale, making it fast to administer and easy to track over time.
The eNPS asks one question: “How likely are you to recommend this company as a place to work?” Scores range from negative 100 to positive 100. A positive eNPS in the trades signals that workers feel respected and see a future with your organization.

Turnover and absenteeism rates are lagging indicators. They confirm a problem after it has already cost you money. Absenteeism trends, on the other hand, can serve as an early warning when tracked weekly rather than monthly.
Behavioral engagement metrics are unique to trades environments and often overlooked. These include:
- Toolbox talk attendance rates: Low attendance signals disengagement before any survey does.
- Near-miss reporting frequency: Workers who trust management report incidents. Silence means distrust, not safety.
- Voluntary overtime acceptance: A proxy for commitment and morale.
- Participation in safety audits: Engaged workers show up for these; disengaged workers avoid them.
| Tool | Frequency | Coverage | Ease of use |
|---|---|---|---|
| ESI survey | Quarterly | All workers | High |
| eNPS | Bi-annual | All workers | High |
| Pulse survey | Monthly or bi-weekly | All workers | Medium |
| Stay interview | Annual or triggered | Individual | Low |
| Exit interview | At separation | Individual | Medium |
| Toolbox talk attendance | Weekly | Site-level | High |
Pro Tip: Run your ESI and eNPS on separate cycles. Combining them in one survey creates response fatigue and muddies the data.
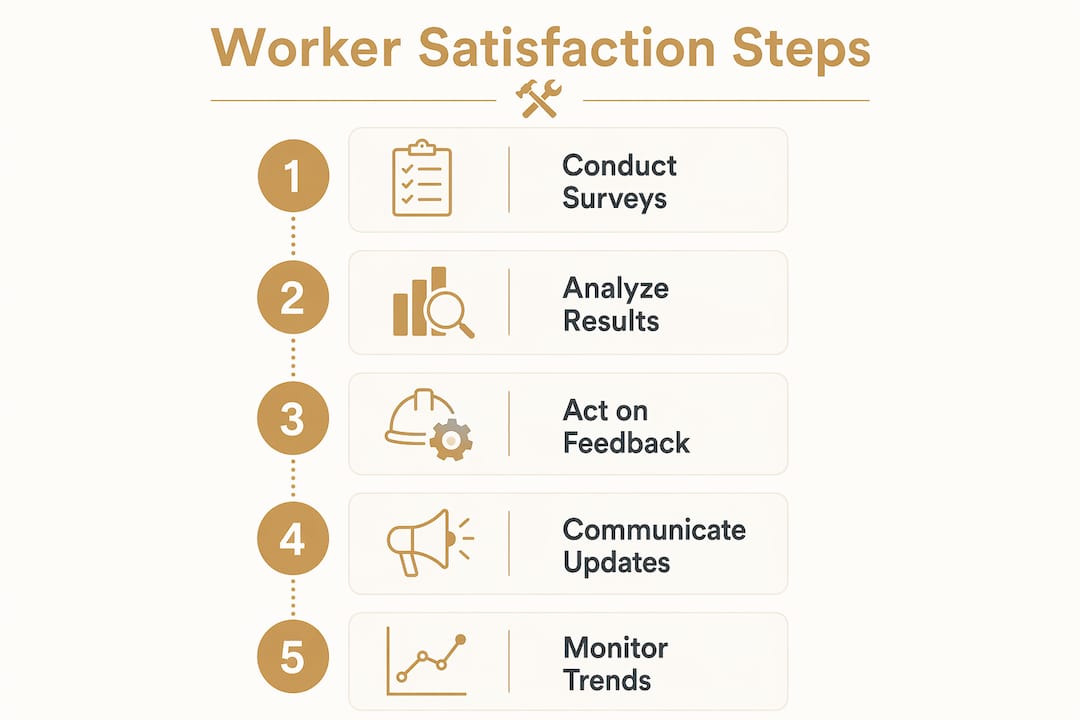
How to collect worker feedback on construction and trade sites
Collecting feedback on a jobsite is not the same as sending an email survey to an office team. Trades workers often have limited literacy and office tech access, which means standard digital survey platforms fail to reach a large portion of your workforce. The fix is a multi-channel approach built around the tools workers already use.
The most effective channels for trades feedback collection are:
- SMS surveys: Short, two to three question texts sent directly to a worker’s phone. Completion rates are high because the barrier is low.
- WhatsApp-based check-ins: Works well for crews that already communicate through the app. A foreman can facilitate the process without requiring workers to download anything new.
- QR codes posted on site: Place them near time clocks, break rooms, or tool cribs. Workers scan and answer two to three questions anonymously during natural breaks.
- Foreman-led verbal check-ins: Structured conversations using a standard set of three to five questions. Foremen record responses digitally. This method works best for workers with low tech comfort.
- Shift-end kiosk or tablet station: A shared device at the site exit captures quick ratings before workers leave.
Scheduling matters as much as channel selection. Sending a survey during peak production hours guarantees low response rates. Align feedback requests with shift patterns, lunch breaks, or end-of-week routines.
Job satisfaction in construction depends more on collaboration and feedback quality than on the tools used to collect it. That means the conversation around the survey matters as much as the survey itself.
Pro Tip: After each survey round, post a visible “You Said, We Did” update on site within seven days. Survey fatigue drops when workers see their input produce a real change. Participation in the next round rises as a direct result.
How to analyze and interpret worker satisfaction data
Sentiment, morale, and engagement are three distinct metrics, and treating them as interchangeable is one of the most common analysis mistakes in trades HR. Comprehensive dashboards that track all three separately prevent one strong signal from masking a problem in another area.
Here is how to distinguish them in practice:
- Sentiment reflects how workers feel right now. It is volatile and shifts with daily events like a scheduling change or a safety incident.
- Morale reflects how workers feel about their work over weeks or months. It moves slowly and signals systemic conditions.
- Engagement reflects how committed workers are to doing their best work. It is the most predictive of productivity and retention.
Leading indicators forecast problems before they appear in turnover data. Declining toolbox talk attendance, rising near-miss silence, and falling eNPS scores are all leading indicators. Lagging indicators like turnover rate and absenteeism confirm what leading indicators already predicted.
Operational signals belong in your satisfaction analysis. Scheduling transparency, tool availability, and clear communication from site managers all affect morale directly. Morale is often a trailing indicator of operational problems, which means a drop in morale scores should trigger an audit of your processes, not a pizza party.
Pro Tip: Before launching any morale campaign, audit three operational areas first: scheduling consistency, tool and material availability, and foreman communication quality. Fix one visible problem before asking workers to fill out another survey.
What are common mistakes when measuring trades worker satisfaction?
The most damaging mistake is collecting feedback and doing nothing visible with it. Survey fatigue results primarily from a lack of visible follow-up, not from survey frequency. Workers stop responding when they believe nothing will change.
Other mistakes that consistently skew data or block improvement:
- Mistaking morale issues for perk deficits. Operational issues, not perks, are the primary cause of low morale. Adding a coffee machine does not fix a broken scheduling system.
- Relying on a single metric. An ESI score alone tells you workers are unhappy. It does not tell you why. A dashboard approach using ESI, eNPS, absenteeism, and behavioral signals gives you the full picture.
- Ignoring differences across trades and sites. An electrician’s satisfaction drivers differ from a pipefitter’s. A worker on a large commercial site faces different pressures than one on a residential job. Segment your data by trade, role, and site.
- Surveying too infrequently. Annual surveys capture a snapshot, not a trend. Monthly pulse surveys with three to five questions give you the trend data needed to act before problems escalate.
- Skipping the communication loop. Workers need to know what you heard and what you plan to do. Without that loop, participation collapses and trust erodes.
Low morale in technical teams increases turnover by 18–43% and raises hiring costs by up to 50%. Quality of management explains 70% of engagement variance. That means fixing your measurement and response process is a direct cost-control measure, not just an HR exercise.
How to build a sustainable satisfaction measurement program
A sustainable program requires three prerequisites before you launch the first survey: leadership buy-in, a technology plan suited to your workforce, and a communication plan that tells workers what to expect and why.
The recommended measurement cadence combines two formats:
- Monthly pulse surveys: Three to five questions, delivered via SMS or QR code. Track ESI and one or two behavioral questions.
- Bi-annual deep surveys: Fifteen to twenty questions covering morale, engagement, operational conditions, and career development. Use these to set benchmarks and identify systemic issues.
Roles and responsibilities must be clear from the start. HR owns the survey design, data analysis, and reporting. Foremen own the on-site facilitation and the “You Said, We Did” communication. Site managers own the operational response to findings.
| Milestone | Timeline | Owner |
|---|---|---|
| Leadership alignment and tool selection | Week 1–2 | HR and senior management |
| Pilot survey on one site | Week 3–4 | HR and site foreman |
| Full rollout with communication plan | Week 5–6 | HR |
| First pulse survey results reviewed | Week 7 | HR and site managers |
| First “You Said, We Did” update posted | Week 8 | Foremen |
| Bi-annual deep survey launched | Month 6 | HR |
Use workforce planning practices to align your measurement cadence with hiring cycles and project timelines. Satisfaction data collected during peak project phases tells a different story than data collected during slow periods. Both are useful, but they require separate interpretation.
Quick wins matter. When workers see a visible change within two to four weeks of a survey, participation in the next round increases. Start with the easiest operational fix your first survey reveals, communicate it clearly, and build from there.
Key Takeaways
Measuring worker satisfaction in skilled trades requires a multi-metric approach combining ESI, eNPS, behavioral signals, and operational audits to produce data that actually drives retention and morale improvements.
| Point | Details |
|---|---|
| Use ESI and eNPS together | Target ESI scores of 75–85 and track eNPS separately to avoid masking issues. |
| Match feedback channels to the workforce | Use SMS, QR codes, and foreman-led check-ins to reach workers with limited tech access. |
| Distinguish sentiment, morale, and engagement | Tracking all three separately prevents one strong signal from hiding a problem in another area. |
| Audit operations before launching campaigns | Scheduling, tool availability, and foreman communication drive morale more than perks do. |
| Close the feedback loop visibly | Post “You Said, We Did” updates within seven days to sustain participation and trust. |
What I’ve learned about satisfaction measurement in the trades
Most HR teams approach trades satisfaction measurement the same way they approach office surveys. They build a form, send it out, and wait for the data to tell them something. That approach fails in the trades, and it fails predictably.
The workers I’ve seen most disengaged were not unhappy about their pay or their benefits. They were frustrated because their foreman got scheduling changes at 5:00 AM, because the right tools were never on the truck, or because nobody ever explained why a process changed. Those are operational failures, not morale failures. The distinction matters because the fix is completely different.
The teams that get this right treat satisfaction data as an operational signal, not a feelings report. They look at near-miss reporting trends alongside ESI scores. They cross-reference absenteeism spikes with scheduling changes. They ask foremen what they are hearing before they design the next survey.
Leadership’s role is not to respond to every complaint. It is to act on the patterns the data reveals and to communicate that action clearly. A foreman who posts a “You Said, We Did” update on the break room wall does more for morale than any company-wide initiative. The trades workforce responds to visible, concrete action. Give them that, and your measurement program will sustain itself.
— SEAN
Field software that supports worker satisfaction in the trades
Debecorp builds its platforms, CHERP and SiteComm, directly from input by tradespeople who work on real jobsites. CHERP manages time and attendance, daily logs, and safety compliance in one place, giving managers the operational data they need to connect process failures to morale trends. SiteComm handles jobsite communication so that scheduling changes, safety updates, and feedback responses reach workers through the channels they actually use.
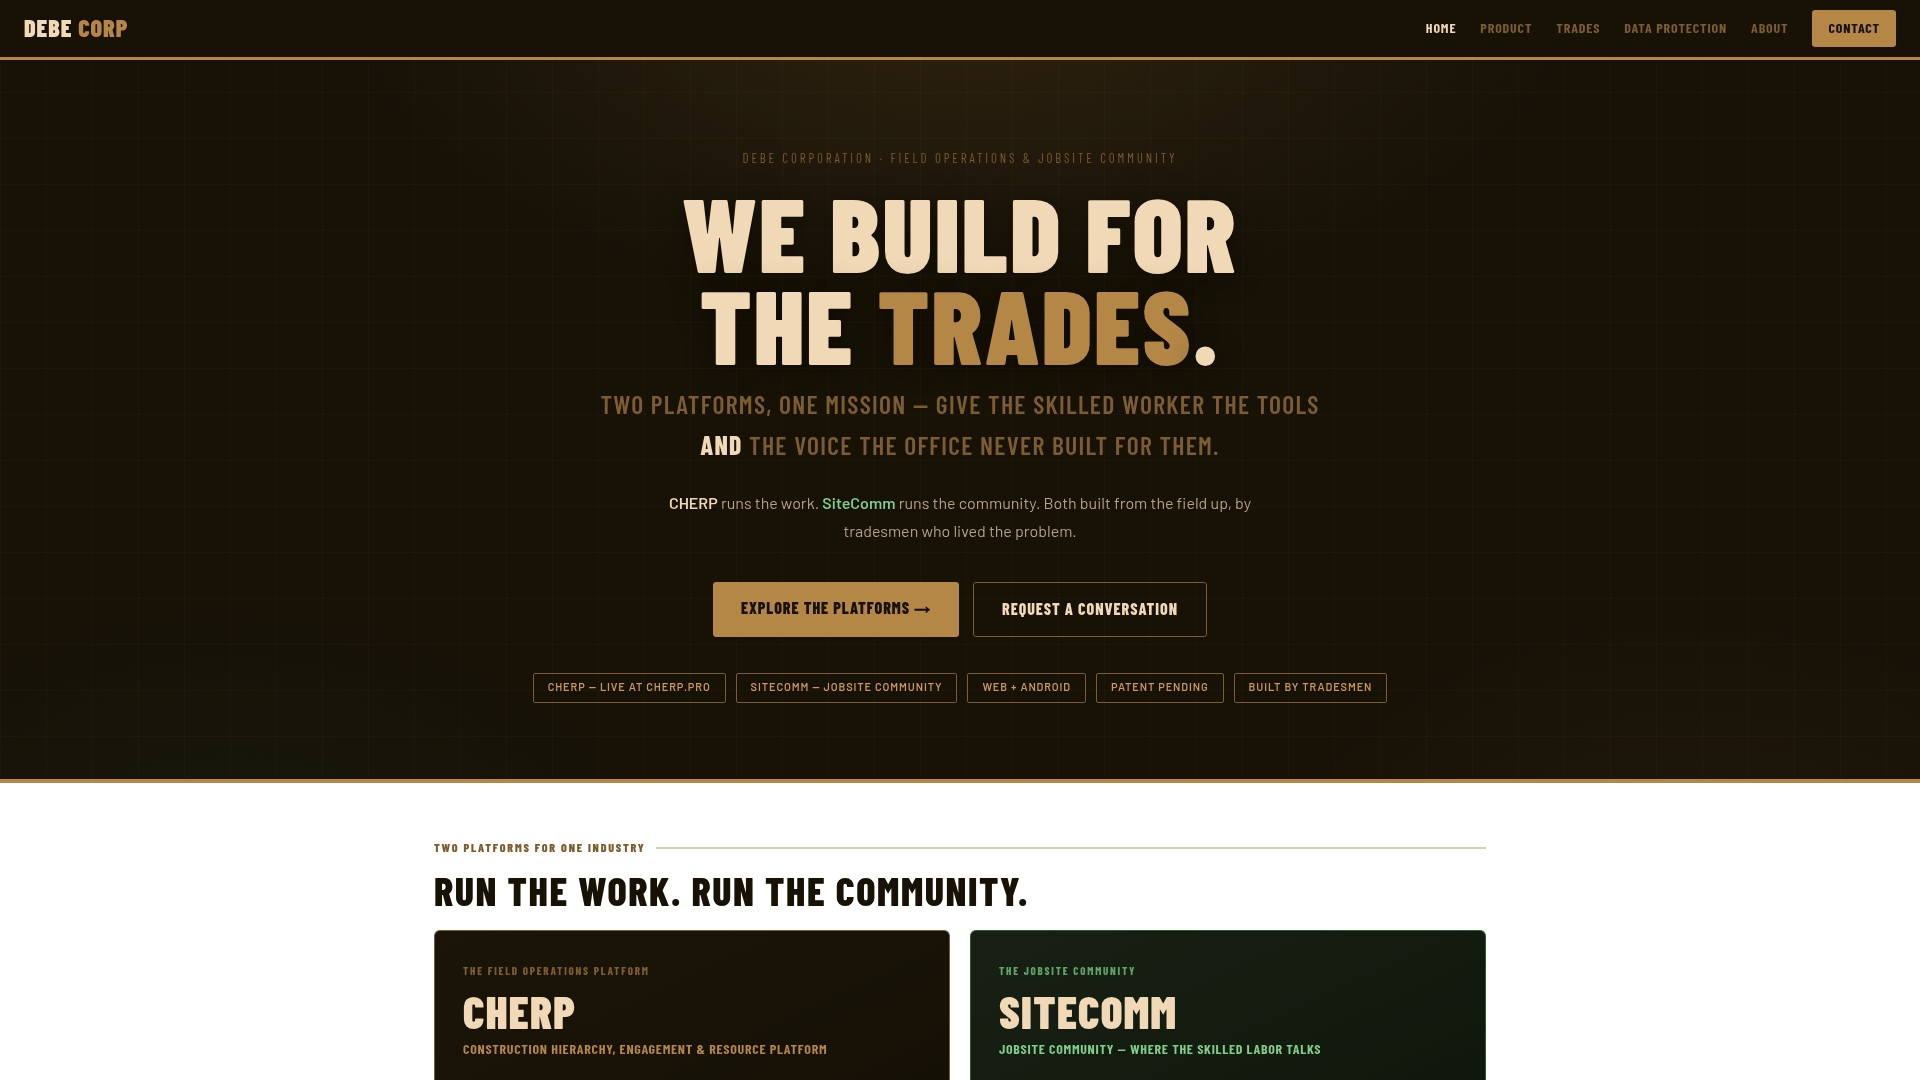
Both platforms are built trade-by-trade, which means the data they capture reflects the real conditions of your specific workforce rather than a generic construction average. For HR teams and site managers who want to move from gut-feel management to data-driven decisions, CHERP and SiteComm give you the operational foundation that makes satisfaction measurement work. You can also see how Debecorp supports 14 specific trades with software built around each craft’s daily workflow.
FAQ
What is the Employee Satisfaction Index in trades?
The ESI is a three-question survey scored on a 0–100 scale. Scores above 70 indicate a healthy workforce, with most organizations targeting 75–85.
How often should trades employers survey their workers?
Monthly pulse surveys of three to five questions work best for tracking trends. Pair them with a bi-annual deep survey to identify systemic issues.
Why do trades workers stop responding to surveys?
Survey fatigue results primarily from a lack of visible follow-up. Workers disengage when they see no action taken on their input.
What is the difference between morale and engagement in the trades?
Morale reflects how workers feel about their conditions over weeks or months. Engagement reflects how committed they are to doing their best work. Both require separate measurement.
How does turnover connect to worker satisfaction in skilled trades?
Higher job satisfaction reduces turnover intention by 53% among licensed skilled trades professionals. Measuring satisfaction systematically is a direct retention strategy.