
Labor turnover in construction is the percentage of your workforce that leaves during a set period, almost always measured over 12 months. The formula is straightforward: divide the number of employees who left by your average headcount during that period, then multiply by 100. If 20 workers left a crew that averaged 80 people, your annual turnover rate is 25%.
Construction runs hotter than most industries. Industry research estimates the national average turnover to be very high, with skilled trades experiencing substantially higher turnover than administrative and project management roles. The Resource Company reported a 2025 industry average of 68.2% overall, with skilled trades at 73.1% and administrative/project management roles closer to 41.3%. Those numbers look alarming until you factor in project-based layoffs, seasonal hiring cycles, and subcontractor churn. For a firm that staffs up every spring and winds down in November, rates in this range may reflect normal project flow rather than a retention crisis. The real question is how much of that turnover is voluntary quits versus end-of-project separations.
Table of Contents
- What does “labor turnover” actually include in construction?
- How to calculate your construction turnover rate
- How do construction turnover rates compare to other industries?
- Why construction turnover is structurally different from other industries
- What does turnover actually cost a construction firm?
- What drives workers to leave construction jobs?
- How to track turnover over time
- Proven retention strategies for construction firms
- How field-ops tools reduce turnover in practice
- A 6-step action plan you can start this week
- Key Takeaways
- The turnover problem most managers are solving wrong
- Debecorp’s CHERP and SiteComm support your retention work
- Useful sources for further reading
What does “labor turnover” actually include in construction?
The standard definition counts every employee who leaves your payroll during the measurement period, but the details matter enormously in construction.
What counts:
- Voluntary resignations (workers who quit)
- Involuntary terminations (fired for cause or performance)
- End-of-project layoffs where the employer initiates the separation
- Retirements
- Workers who do not return after a seasonal layoff
What does not count:
- Internal transfers between projects within the same company, where the worker stays on your payroll
- Short-term reassignments to a different crew or site
- 1099 subcontractors and independent contractors (they are not employees, so they fall outside the standard metric)
Beyond the basic annual rate, you should track at least three variants. Monthly separation rates catch seasonal spikes before they compound. Project-level turnover tells you whether a specific superintendent or site condition is driving exits. Cohort turnover, especially for workers in their first 90 days or first year, reveals whether your onboarding is failing before workers ever get settled.
The distinction between voluntary and involuntary exits is where most firms go wrong. Buildforce notes that some companies reduce their workforce by up to 50% at project end. If you lump those layoffs in with voluntary quits, your headline rate looks catastrophic when the underlying retention picture is actually fine. Separate the two categories from day one.
How to calculate your construction turnover rate
The primary formula is simple, but the inputs require care.
Standard annual formula:
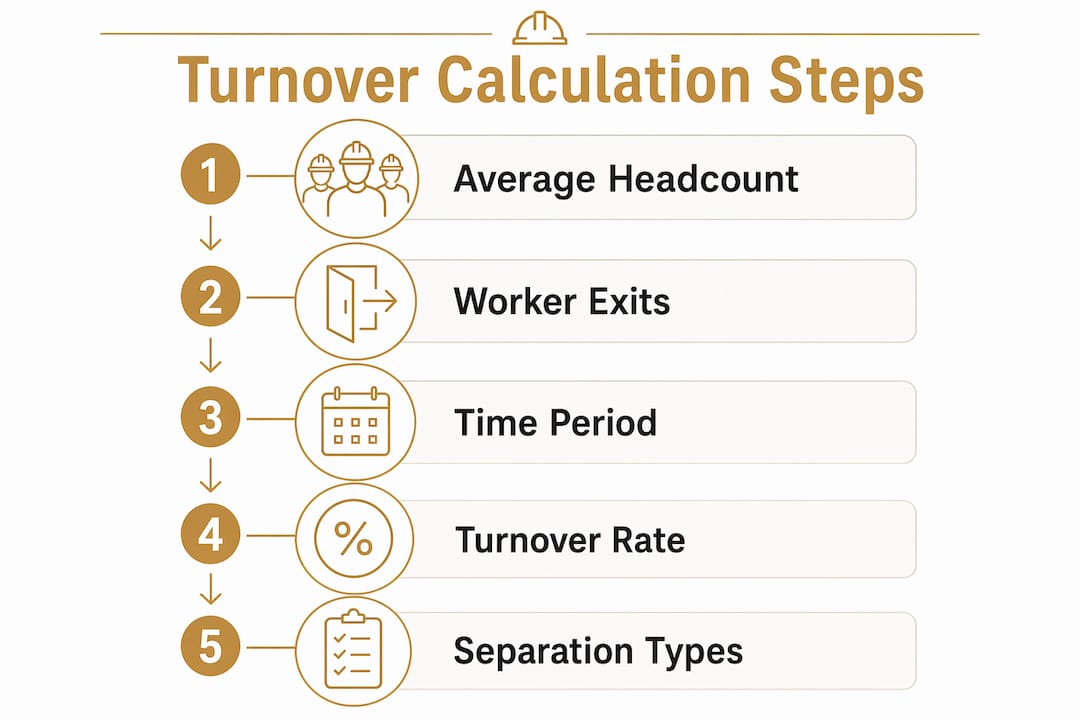
- Count every employee who left your payroll during the 12-month period.
- Calculate average headcount: add your headcount at the start of the period to the headcount at the end, then divide by two.
- Divide departures by average headcount, then multiply by 100.
Worked example:
A mid-size general contractor starts the year with 120 workers and ends with 100. Average headcount = (120 + 100) ÷ 2 = 110. During the year, 33 workers left (18 end-of-project layoffs, 15 voluntary quits). Total turnover rate and voluntary quit rate are calculated to understand retention dynamics.
That 13.6% voluntary rate is the number worth watching. The layoffs are planned and budgeted; the quits are the signal.
Calculation variants:
- Monthly separation rate: (Separations in month ÷ average headcount that month) × 100. Useful for spotting seasonal spikes.
- Role-specific rate: Run the same formula for each trade or job category separately. Skilled trades and general laborers typically run higher rates than supervisors or office staff.
- First-year cohort rate: (New hires who left within 12 months ÷ total new hires in that cohort) × 100. A high first-year rate points to onboarding or early-tenure problems.
Common pitfalls to avoid:
- Counting an internal project transfer as an exit inflates your rate artificially.
- Treating a temporary layoff as a permanent separation skews the involuntary count.
- Using end-of-period headcount instead of average headcount understates the denominator and inflates the rate.
- Mixing 1099 subcontractors into your employee count distorts every calculation.
Pro Tip: Build a simple spreadsheet with four columns: worker name, hire date, separation date, and separation type (voluntary/involuntary/project-end). Running the formula monthly takes under 10 minutes and gives you a trend line within a quarter.
How do construction turnover rates compare to other industries?
Construction consistently ranks among the highest-turnover industries in the U.S. The BLS Job Openings and Labor Turnover Survey reported a total separations rate of 3.0% for construction in March 2026 on a monthly, not-seasonally-adjusted basis, with monthly figures fluctuating significantly.
The table below shows how rates typically break down by role type, based on industry reporting. Use these as orientation ranges, not hard targets.
| Role type | Typical turnover level | Key driver | Seasonal inflation risk |
|---|---|---|---|
| General labor | Very high | Project-end layoffs, pay competition | High |
| Skilled trades | High | Mobility for small pay gains, project cycles | High |
| Foremen / supervisors | Moderate | Management quality, career path | Moderate |
| Admin / project managers | Moderate | Workload, company culture | Low |
A few caveats on reading these numbers. Methodology differences between sources can shift headline rates by 20 percentage points or more. Some surveys count payroll separations; others use active headcount. Some include seasonal rehires as new hires each cycle, which inflates annual figures. ADP research found that construction turnover climbs to roughly 3.56% per month in summer versus about 3.14% in non-summer months, confirming that seasonal variance is real and predictable.
When you benchmark your own rate, compare it against the same role type and the same season. A 60% annual rate for general laborers on a project-heavy firm is not the same problem as a 60% rate for your project managers.
Why construction turnover is structurally different from other industries
Construction is not like retail or healthcare, where turnover mostly reflects individual choices. Several structural features of the industry create turnover that is partly unavoidable and partly addressable.

Seasonal demand and project lifecycles drive the biggest swings. A firm that wins a large commercial contract in March will hire aggressively through summer and then release much of that crew when the project closes in October. That pattern repeats every year and shows up as high annual turnover even when workers are happy and would return next season.
Subcontracting and contingent labor blur the line between your workforce and someone else’s. When a specialty subcontractor’s crew walks off your site at project end, that is not your turnover, but it affects your schedule and your institutional knowledge just as much. General contractors who rely heavily on subs need to track their own direct-hire workforce separately and be honest about what they can actually influence.
Pay mobility is unusually high. A Buildforce survey found that roughly half of construction workers would switch employers for a modest hourly raise or a one-time bonus. When the difference between staying and leaving is $1–$2 per hour, loyalty is fragile. Competitive bidding keeps margins thin, which makes it hard for firms to match every offer, but even small, targeted adjustments for high-performers can close the gap.
Safety and physical conditions are a retention factor that managers often underestimate. Workers who feel unsafe, or who are grinding through poor site conditions without acknowledgment, leave. Construction safety data consistently shows that firms with stronger safety cultures see lower incident rates, and lower incident rates correlate with better retention and lower recruitment costs tied to incident fallout.
Geographic mobility compounds everything. Skilled tradespeople can and do follow work across state lines. A carpenter in the Midwest who hears about a large infrastructure project two states away may simply go. That kind of exit is nearly impossible to prevent with retention tactics alone.
What does turnover actually cost a construction firm?
Most managers think about turnover in terms of recruiting fees. The real number is much larger, and most of it is invisible on a standard P&L.
| Cost category | Type | Sample estimate per exit |
|---|---|---|
| Job posting and recruiting | Direct | — |
| Interviewing and screening time | Direct | — |
| Onboarding and paperwork | Direct | — |
| Safety orientation and certifications | Direct | — |
| Reduced productivity during ramp-up (4–8 weeks) | Indirect | — |
| Lost institutional knowledge | Indirect | Hard to quantify; often — |
| Schedule slippage and overtime to cover gaps | Indirect | — |
| Increased safety incident risk during transition | Indirect | Variable |
Note: These are illustrative ranges based on industry cost frameworks, not audited figures. Your actual costs depend on role, market, and project type.
For a 100-person firm running substantial annual turnover, that means many exits per year. Estimated costs per exit can accumulate to substantial annual turnover expenses, making the business case for retention investment. That is the business case for retention investment, and it is usually more persuasive to an executive than any engagement survey.
The soft costs deserve more attention than they typically get. A new hire on a crew takes four to eight weeks to reach full productivity. During that window, a more experienced worker is often pulled off their own tasks to supervise, which compounds the productivity loss. Tracking labor productivity alongside turnover data makes this cost visible and defensible.
What drives workers to leave construction jobs?
Pay is the most common trigger, but it is rarely the only one. Here are the causes that show up most consistently, along with the early warning signs that precede each.
Pay and benefits gaps. Workers compare notes. When a laborer discovers a peer at a competing firm earns $2 more per hour, the mental math on leaving starts immediately. Early signs: workers asking about raises more frequently, informal conversations about competitor wages, declining overtime acceptance.
Limited career development. A skilled carpenter who sees no path to foreman or superintendent will eventually leave for a firm that offers one. Early signs: workers asking about advancement, disengagement from training opportunities, flat tenure distribution with few long-tenured employees.
Poor site communication. When workers do not know the schedule, do not understand their assignments, or hear about project changes through the grapevine instead of their foreman, trust erodes fast. Early signs: repeated questions about the same information, confusion about scope changes, workers showing up to the wrong location. Reducing jobsite miscommunication is one of the fastest wins available to a manager.
Unsafe or uncomfortable conditions. Workers tolerate hard physical work. They do not tolerate feeling like their safety is an afterthought. Early signs: rising near-miss reports, workers declining certain tasks, informal complaints about equipment or site conditions.
Inconsistent scheduling. Unpredictable hours create childcare problems, second-job conflicts, and general stress. Early signs: increased absenteeism, last-minute call-outs, workers requesting schedule changes more frequently.
Foreman and leadership quality. A bad foreman is the single fastest driver of voluntary quits on a crew. Workers do not leave companies; they leave supervisors. Early signs: crew-specific turnover spikes, morale differences between crews, workers requesting transfers.
Quick diagnostic checklist for exit analysis:
- Did the worker leave voluntarily or involuntarily?
- Was pay cited as a factor in the exit interview?
- How long had the worker been with the company?
- Which crew and foreman were they assigned to?
- Were there any safety incidents or near-misses in the 60 days before departure?
- Did the worker have a defined career path or development plan?
How to track turnover over time
A single annual rate tells you where you are. A trend line tells you where you are going. Here is the measurement framework that gives you both.
Essential metrics to track:
- Total annual turnover rate
- Voluntary quit rate (separated from involuntary)
- First-90-day turnover rate for new hires
- First-year turnover rate
- Role-specific rates by trade and job category
- Project-level turnover rates
Cohort recommendations: Track every hire-date cohort through their first 90 days and first year. A spike in first-90-day exits almost always points to onboarding or early-assignment problems. A spike in 6–12 month exits often signals career path or pay dissatisfaction. These two cohorts tell different stories and require different fixes.
Data sources: Payroll records are the most reliable source for separation dates and types. Time-and-attendance logs catch attendance pattern changes before a formal exit. HRIS systems, where they exist, can automate cohort tracking. Crew foreman reports are underused but valuable for capturing informal signals that payroll data misses. Workforce planning frameworks can help you align these sources into a single tracking system.
Reporting cadence:
| Frequency | What to report | Key dashboard fields |
|---|---|---|
| Weekly | Attendance anomalies, new separations | Headcount, absences, open positions |
| Monthly | Separation rate by type, new hire count, time-to-fill | Voluntary quits, involuntary exits, cost-per-exit |
| Quarterly | Cohort turnover, role-specific rates, trend vs. prior quarter | First-90-day rate, first-year rate, annualized total rate |
One alignment note: make sure your payroll system and your HRIS use the same definition of “separation date.” A one-week discrepancy in how systems record the last day can create phantom exits or missed counts that corrupt your trend data.
Proven retention strategies for construction firms
Not all retention levers are equal. Some show results in 30 days; others take a year to move the needle. Here is a prioritized list, ordered by speed of impact.
Immediate fixes (results within 30–90 days)
-
Conduct a pay market check. Pull current wage data from BLS Occupational Employment Statistics for your trades and region. If you are more than 5% below market on any high-turnover role, adjust before the next paycheck cycle. Given that roughly half of construction workers would leave for a modest raise, this is the highest-ROI move available.
-
Publish schedules two weeks in advance. Predictable scheduling reduces absenteeism and last-minute quits. It costs nothing except planning discipline.
-
Fix the most visible safety issue on each site. Ask foremen to name the one safety concern their crew raises most often, then address it visibly within two weeks. Workers notice when management acts on safety feedback.
-
Standardize exit interviews. You cannot improve what you do not measure. A five-question exit interview (see the action plan section below) takes 15 minutes and generates the data you need to prioritize everything else.
Medium-term investments (results in 3–6 months)
-
Launch a structured onboarding program. First-90-day turnover is disproportionately high in construction. A structured first week, a 30-day check-in, and a 90-day review cut early exits significantly. Assign a buddy or mentor from the existing crew.
-
Train foremen on retention basics. Foreman behavior drives more voluntary quits than any other single factor. A half-day workshop on feedback, scheduling communication, and recognizing good work costs less than one replacement hire.
-
Create visible career ladders. Post the path from laborer to journeyman to foreman to superintendent. Workers who can see a future with your company stay longer. Understanding why skilled workers leave often comes down to this single factor.
Longer-term culture shifts (results in 6–12 months)
-
Build an apprenticeship or upskilling program. Partner with a local union hall, community college, or trade association to offer structured skills development. Workers who are learning stay engaged.
-
Implement a formal recognition system. Monthly crew recognition, safety milestone acknowledgment, and tenure bonuses signal that the company values longevity.
-
Invest in safety culture. Firms with lower incident rates spend less on recruiting and see higher retention. Safety investment is not just a compliance cost; it is a retention strategy.
How field-ops tools reduce turnover in practice
The connection between operational software and retention is not obvious until you trace the friction points that drive workers out. Pay errors, schedule confusion, and safety paperwork that falls through the cracks are not just administrative annoyances. They erode trust, and eroded trust leads to exits.
Debecorp built CHERP and SiteComm from the ground up with input from tradespeople who lived these friction points firsthand. The feature-to-outcome mapping is direct:
- Time and attendance tracking eliminates pay disputes. When workers know their hours are recorded accurately and automatically, one of the most common sources of resentment disappears.
- Daily logs and safety checklists create a documented record that protects workers and supervisors alike, and they make safety compliance a routine rather than a scramble.
- Centralized crew updates via SiteComm replace the grapevine with a single source of truth. Workers who know what is happening on their site feel less anxious and more connected to the project.
A practical pilot workflow looks like this: crew check-in via CHERP at the start of shift, a five-minute daily safety log completed by the foreman, a brief end-of-day note on task completion, and payroll data that flows directly from attendance records. The foreman spends less time on paperwork and more time on the crew. Workers see accurate pay stubs and a foreman who is present rather than buried in forms.
Sample KPIs for a 90-day pilot:
- Voluntary quit rate for the pilot crew vs. a control crew
- Pay dispute frequency (target: zero disputes from attendance errors)
- Safety near-miss reports (track whether visibility increases reporting, which is a good sign)
- First-90-day retention rate for new hires on the pilot crew
Pro Tip: Run the pilot on one crew with a foreman who is already respected by their team. A motivated foreman using the tools correctly will generate results faster and create a peer-advocacy effect when you scale.
Reducing information silos between the field and the office is one of the fastest ways to improve the daily experience of being on a crew. Workers who feel informed and fairly paid are dramatically less likely to take a call from a competitor.
A 6-step action plan you can start this week
Turn this guide into tasks. Here is the sequence that moves from measurement to measurable improvement.
-
Define your measurement rules. Decide today what counts as a separation (voluntary, involuntary, project-end), what your measurement period is, and whether subcontractors are included. Write it down so every manager uses the same definition.
-
Run a 90-day diagnostic cohort. Pull your last 12 months of separation data from payroll. Calculate your total rate, your voluntary quit rate, and your first-year turnover rate. Segment by role and by crew. This is your baseline.
-
Prioritize one or two quick fixes. Based on your diagnostic, pick the highest-frequency cause. If pay is the issue, run a market check this week. If scheduling is the issue, publish a two-week schedule before Friday. Quick wins build credibility for larger investments.
-
Design a 90-day pilot. Select one crew. Define three KPIs: voluntary quit rate, first-90-day retention for any new hires, and cost-per-exit. Implement your chosen fix and track weekly.
-
Measure and iterate. At the 90-day mark, compare your pilot crew’s metrics to a control crew. If the voluntary quit rate dropped, scale the fix. If it did not move, revisit your cause diagnosis.
-
Scale successful fixes and communicate wins. Tell your crews what changed and why. Workers who see that feedback leads to action are more likely to stay and more likely to give you honest feedback next time.
Exit interview template (5 questions):
- What was the primary reason for your decision to leave?
- Was there anything the company could have done to change your decision?
- How would you describe the communication from your foreman and management team?
- Did you feel your pay and benefits were competitive with the market?
- Would you consider returning to work with us in the future?
Pilot KPI list:
- Voluntary quits (pilot crew vs. control crew)
- First-90-day retention rate for new hires
- Cost-per-exit (direct costs only for simplicity)
- Attendance rate (as a leading indicator)
For stakeholder alignment, bring your baseline data to the conversation. A number like “$240,000 in estimated annual turnover costs” gets executive attention faster than a percentage point. Get sign-off from the project manager or operations lead before the pilot starts so they are invested in the outcome.
Key Takeaways
Construction labor turnover is a measurable, manageable metric, and separating voluntary quits from project-end layoffs is the single most important step toward understanding your real retention picture.
| Point | Details |
|---|---|
| Definition and formula | Turnover = (workers who left ÷ average headcount) × 100; track voluntary quits separately from layoffs. |
| Industry benchmarks | The 2025 national average runs high overall; skilled trades experience substantially higher turnover than administrative roles. |
| Top measurement practice | Track first-90-day and first-year cohort rates alongside the annual total to surface onboarding and career-path problems early. |
| Highest-impact retention levers | Pay market alignment, predictable scheduling, and foreman training deliver the fastest voluntary quit reductions. |
| Recommended pilot approach | Run a 90-day pilot on one crew with three KPIs: voluntary quit rate, first-90-day retention, and cost-per-exit. |
| Debecorp’s role | CHERP and SiteComm reduce pay errors, centralize crew updates, and simplify safety logs, directly addressing the friction points that drive voluntary exits. |
The turnover problem most managers are solving wrong
Construction managers tend to treat turnover as a recruiting problem. Hire faster, post more jobs, widen the net. That response addresses the symptom while leaving the cause untouched.
The data points somewhere more specific. When half your workforce would leave for a modest hourly raise, and when first-year turnover runs higher than tenure-based turnover, the problem is not the labor market. It is the daily experience of being on your crew. Pay matters, but so does whether a worker knows their schedule on Monday morning, whether their foreman acknowledges good work, and whether their paycheck reflects the hours they actually worked.
Debecorp built CHERP and SiteComm because tradespeople told them, directly, what was making their jobs worse. Not abstract engagement surveys. Actual conversations about what was broken on actual jobsites. That origin matters because it means the tools address real friction, not theoretical friction.
The firms that will close the gap on voluntary turnover over the next few years are not the ones that hire the fastest. They are the ones that make staying the easier choice. That means fixing pay where it is out of market, giving foremen the tools and training to lead well, and removing the daily irritants that make a competing offer feel worth the risk.
Measurement is where it starts. You cannot prioritize what you have not quantified. Run the formula, split voluntary from involuntary, and look at your first-year cohort. The answer to where your retention problem lives is usually in those three numbers.
Debecorp’s CHERP and SiteComm support your retention work
Tracking turnover is one thing. Fixing the daily conditions that drive it is another. Debecorp’s CHERP and SiteComm platforms were built specifically for field operations in the trades, covering time and attendance, daily logs, and safety compliance in one place. For managers who have just run their first voluntary quit analysis and found pay errors and communication gaps at the root, these tools address both directly. Accurate attendance records mean accurate paychecks. Centralized crew updates via SiteComm mean workers hear about schedule changes from their foreman, not the grapevine. Safety checklists built into the daily workflow mean compliance is a habit, not a scramble.

If you are ready to move from measuring turnover to reducing it, start by looking at the workflows your crews use every day. Visit debecorp.com to see how CHERP and SiteComm fit the pilot framework described in this guide, and request a walkthrough tailored to your trade and crew size.
Useful sources for further reading
The sources below are worth bookmarking if you want to go deeper on any section of this guide.
-
BLS Construction Industry Overview: The Bureau of Labor Statistics provides monthly employment, hires, and separations data for NAICS 23 (Construction). Use this for current benchmark comparisons and to track seasonal patterns in your region.
-
FRED Total Separations: Construction: The St. Louis Fed’s FRED database publishes the BLS Job Openings and Labor Turnover Survey data in an easy-to-chart format. Useful for tracking the monthly separations rate over time.
-
The Resource Company — 2025 Construction Turnover Research: Provides role-level turnover breakdowns including the 68.2% industry average and the 73.1% skilled trades figure cited in this guide.
-
Buildforce Blog — Why Is Employee Turnover High in Construction?: Covers project-end layoff dynamics, the pay mobility survey data, and practical framing for separating structural turnover from retention failures.
-
For Construction Pros — ADP Turnover Research: ADP’s seasonal analysis and retention strategy recommendations; useful for understanding monthly rate variance and building a retention program.
-
My Safety Solution — OSHA Safety Statistics: Aggregated OSHA and industry safety data; useful when building the business case for safety investment as a retention lever.